Every year at Mayflower, we come together for our Barcamp — a few days where we set aside the usual routines to dive into topics we’re passionate about. It’s a casual and collaborative event that brings out the best in everyone’s creativity. This year, for me, that spark came in the form of a Pixelflut server a colleague had set up on a big screen in the office.
If you’re not familiar with it, a Pixelflut server is a wonderfully simple setup: a giant canvas waiting for pixel data. Anyone with a bit of code can send their contributions, and the results appear instantly. Whether it’s minimalist shapes or elaborate animations, the protocol’s simplicity and the results‘ immediacy make it incredibly satisfying to play with.
It didn’t take long for me to get hooked. Between Barcamp sessions, I kept finding myself drawn back to the screen, testing out ideas and building small programs to interact with it. By the end of the event, I’d thrown together a quick application to send a live feed of my laptop screen to the server — a fun little experiment that left me wanting more.
Weeks later, that experience was still on my mind. With more time to focus, I decided to revisit the topic and see how far I could push it. What started as a casual Barcamp diversion turned into a deep dive into performance optimization and creative problem-solving.
In the chapters ahead, I’ll walk you through the project, the steps I took, and the challenges I encountered. It might have started as a playful experiment, but it turned out to be a rewarding technical challenge and a lot of fun along the way.
Understanding the Pixelflut Protocol
Before diving into the specifics of the project, let’s take a closer look at what makes the Pixelflut protocol so unique.
At its core, Pixelflut is a lightweight ASCII-based network protocol designed for one purpose: drawing pixels on a screen. The authors describe it as „very simple (and inefficient),“ which is part of its charm. In fact, you can write a basic client in just a single line of shell code. But simplicity comes at a cost — Pixelflut doesn’t handle higher-level drawing functions like rectangles, lines, or text. If you want anything beyond individual pixels, it’s up to you to implement those features yourself. That’s the challenge — and the fun — of working with it.
How It Works
The protocol operates on straightforward, human-readable commands. Here’s the basic syntax for sending pixel data straight from the documentation:
PX <x> <y> <rrggbb(aa)>

Explanation: Draw a single pixel at position (x, y) with the specified hex color code. If the color code contains an alpha channel value, it is blended with the current color of the pixel.
Commands are sent over a TCP connection, and you can send as many commands as you like in a single session, as long as each one is terminated with a newline character (`\n`). This means you can fire off a stream of pixel commands in rapid succession, limited only by the speed of your client, the network, and the server’s ability to process them.
Kurze Unterbechung
Das ist dein Alltag?
Keine Sorge – Hilfe ist nah! Melde Dich unverbindlich bei uns und wir schauen uns gemeinsam an, ob und wie wir Dich unterstützen können.
Defining the New Project
That simple screencast experiment had been a fun detour, but it left me wondering — what could I achieve if I dedicated more time and effort to it? With the luxury of a bit more focus and the itch to push my technical limits, I decided to revisit the protocol with a fresh perspective.
This time, I wanted to do more than just play around. I wanted a project that would challenge me and take full advantage of Pixelflut’s potential. But the lack of higher-level drawing calls of the protocol also meant I’d need to get creative, both in designing the project and in optimizing its performance.
Setting the Objective
The first step was deciding what to create. I wanted something visually engaging, technically demanding, and ideally a bit whimsical – because where’s the fun without a touch of silliness? After brainstorming and exploring a few ideas, I settled on a goal: stream the iconic animation Bad Apple to the Pixelflut server.
I wanted to see how fast I could transmit pixel data to the server while maintaining accuracy and smooth playback. That became my central challenge, and I was ready to dive in.
What Is „Bad Apple“?
For the uninitiated, „Bad Apple“ is a black-and-white animation initially created as part of the Touhou Project video game series. It has since gained a life of its own, with countless remixes and recreations. Its stark contrast and relatively low resolution make it ideal for experiments in environments with limited display capabilities.
With the goal clear, I had a well-defined challenge in front of me: take the 6,569-frame animation and stream it to Pixelflut as smoothly and quickly as possible. Now, it was time to bring the idea to life.
First Iteration: Making it Work
To stream „Bad Apple“ to the Pixelflut server, the first step was to extract the animation’s individual frames and send them to the server. The focus at this stage was getting something functional, even if it wasn’t optimized yet. Feel free to checkout the GitHub repo and follow along with more details.
To start, I needed the individual frames of the animation. I downloaded the video from the Internet Archive and used FFmpeg, a powerful multimedia processing tool, to extract the frames.
Once I had the frames, the next step was to send their pixel data to the Pixelflut server. This required processing each frame to extract the pixel values and converting them into the Pixelflut protocol’s PX commands. Here’s what that looked like in the code:
public static void main(String[] args) {
    try (var socket = new Socket("localhost", 1337);
        var writer = new PrintWriter(socket.getOutputStream(), false);
        var frameGrabber = new FFmpegFrameGrabber("Touhou_Bad_Apple.mp4")) {
        frameGrabber.start();
        var image = frameGrabber.grabImage();
        var width = image.imageWidth;
        var height = image.imageHeight;
        var offsetPerLine = (image.imageStride/3) - width;
        while (image != null) {
            var startTime = System.currentTimeMillis();
            var buffer = (ByteBuffer) image.image[0];
            for (int y = 0; y < height ; y++) {
                var yOffset = y*width + y*offsetPerLine;
                for (int x = 0; x < width; x++) {
                    var index = (x + yOffset) * 3;
                    writer.println("PX " + x + " " + y + " " + String.format("%06X", ((buffer.get(index) & 0xFF) << 16) + ((buffer.get(index + 1) & 0xFF) << 8) + (buffer.get(index + 2) & 0xFF)));
                }
            }
            writer.flush();
            image = frameGrabber.grabImage();
        }
    } catch (Exception e) {
        //[...]
    }
}
This code initializes a connection to the Pixelflut server, reads each frame of the video using FFmpeg, and sends the pixel data line-by-line as PX commands.
Challenges and Observations
While this first implementation worked, it came with noticeable limitations:
Performance Issues: The application only achieved about 11 FPS, far below the animation’s native frame rate. This made the playback feel quite choppy.
Visual Artifacts: Screen tearing was a frequent issue. This occurs because parts of the frame update at different times, creating visible seams or mismatched sections on the display.
String Formatting Overhead: Using `String.format` for every pixel’s color conversion introduced a significant bottleneck. Profiling the application with Java VisualVM revealed that around 70% of the runtime was spent in this function alone. While the simplicity of this approach was appealing, it was clear it wasn’t sustainable for high-performance streaming.

Despite these challenges, the implementation gave me the basic pipeline, so the next step was to tackle these inefficiencies and push the frame rate closer to real-time.
Second Iteration: Removing String.format
To eliminate the overhead of `String.format`, I implemented a lookup table for hexadecimal values. Instead of formatting each pixel’s RGB values on the fly, this approach precomputed all possible two-character hex strings in the range 00 to FF. Here’s the relevant code:
private static final String[] hexTable = IntStream.iterate(0, i -> i + 1)
    .mapToObj(i -> String.format("%02X", i))
    .limit(256)
    .toArray(String[]::new);
//[...]
writer.println("PX " + x  + " " + y + " " + formatPixelValue(buffer.get(index), buffer.get(index + 1), buffer.get(index + 2)));
//[...]
private static String formatPixelValue(byte r, byte g, byte b) {
    return hexTable[r & 0xFF] + hexTable[g & 0xFF] + hexTable[b & 0xFF];
}
The lookup table eliminates repetitive calls to the computationally expensive `String.format` function. Instead, each pixel’s RGB values are mapped directly to their precomputed hexadecimal representations, significantly reducing the time required to prepare the PX commands.
Results and Observations
The change significantly improved performance, and the frame rate jumped from around 11 FPS to above 30 FPS!
The reduced latency also resulted in much smoother playback, with fewer visible artifacts.
While this iteration greatly improved the streaming performance, I wanted to see how far I could still go with this project, so back to the VisualVM we go!

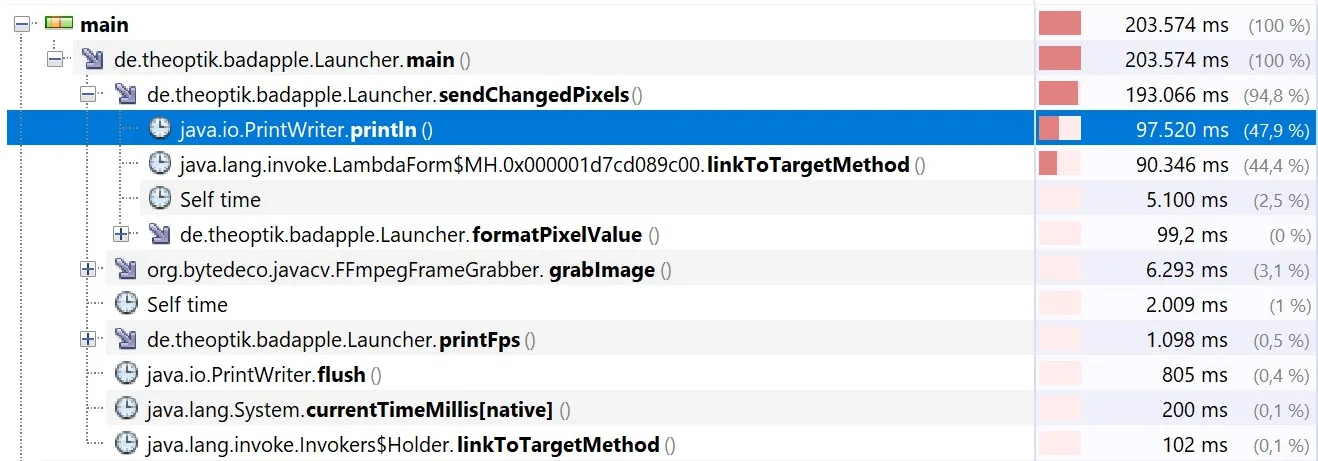
This time, the `println` function appeared to be the largest contributor to processing time.
While addressing this bottleneck was essential, I think first it is time to implement are more straight forward improvement.
Third Iteration: Sending Only the Delta
After significantly improving the frame rate by optimizing pixel formatting, the next step was to reduce the amount of data sent to the Pixelflut server. So far, the program transmits every pixel for every frame, even if the pixel hasn’t changed. This is inefficient and unnecessary. The solution? Delta frames are only sending pixels that have changed from the previous frame.
Implementing Delta Frames
To implement this optimization, I introduced a function to compare each pixel of the current frame to the corresponding pixel in the previous frame. If a pixel’s RGB values hadn’t changed, it was skipped. Here are the relevant code changes:
//[...]
if (frameCounter == 0) {
    sendChangedPixels(height, width, offsetPerLine, writer, buffer, (x, y, r, g, b) -> true);
} else {
    sendChangedPixels(height, width, offsetPerLine, writer, buffer, (x, y, r, g, b) -> {
        var index = (x + y * width) * 3;
        var result = previousFrame[index] != r || previousFrame[index + 1] != g || previousFrame[index + 2] != b;

        previousFrame[index] = r;
        previousFrame[index + 1] = g;
        previousFrame[index + 2] = b;

        return result;
    });
}
//[...]
private static void sendChangedPixels(int height, int width, int offsetPerLine, PrintWriter writer, ByteBuffer buffer, HasValueChanged changeDetector) {
    for (int y = 0; y < height; y++) {
        var yOffset = y * width + y * offsetPerLine;
        for (int x = 0; x < width; x++) {
            var index = (x + yOffset) * 3;
            byte r = buffer.get(index);
            byte g = buffer.get(index + 1);
            byte b = buffer.get(index + 2);
            if (changeDetector.hasChanged(x, y, r, g, b)) {
                writer.println("PX " + x + " " + y + " " + formatPixelValue(r, g, b));
            }
        }
    }
}
For the first frame, every pixel is sent, as there’s no previous frame for comparison. For all subsequent frames, the `sendChangedPixels` function uses a lambda to determine if a pixel’s value has changed.
If the pixel’s RGB values differ from those in the previous frame, they are sent to the server.
The `previousFrame` array is then updated with the current pixel values for the next comparison.
By skipping unchanged pixels, the amount of data sent to the Pixelflut server decreased significantly, especially in sections of the animation with minimal movement. The reduction in transmitted data enabled the application to achieve a frame rate ranging from 100 to 300 FPS, depending on the degree of difference between frames.
Fourth Iteration: Who Needs Strings Anyway?
After implementing delta frames, the next major bottleneck identified was the aforementioned use of the `println` function. While convenient, this approach introduced unnecessary overhead in the function itself and in the code due to the need to concatenate strings. To address this, I switched to using a `BufferedOutputStream` and replaced string concatenation with direct byte array operations.
The new approach involved precomputing the byte arrays for coordinates and colors and then writing the bytes directly to the output stream. Here’s how the key logic was updated:
private static final byte[] message = "PX 000 000 000000\n".getBytes();
//[...]
private static void sendChangedPixels(int height, int width, int offsetPerLine, OutputStream outputStream, ByteBuffer buffer, HasValueChanged changeDetector) throws IOException {
    for (int y = 0; y < height; y++) {
        var yOffset = y * width + y * offsetPerLine;

        var yBytes = formatCoordinateValue(y);
        message[yCoordinateOffset] = yBytes[0];
        message[yCoordinateOffset + 1] = yBytes[1];
        message[yCoordinateOffset + 2] = yBytes[2];

        for (int x = 0; x < width; x++) {

            var xBytes = formatCoordinateValue(x);
            message[xCoordinateOffset] = xBytes[0];
            message[xCoordinateOffset + 1] = xBytes[1];
            message[xCoordinateOffset + 2] = xBytes[2];

            var index = (x + yOffset) * 3;
            byte r = buffer.get(index);
            byte g = buffer.get(index + 1);
            byte b = buffer.get(index + 2);
            byte[] rBytes = formatColorValue(r);
            byte[] gBytes = formatColorValue(g);
            byte[] bBytes = formatColorValue(b);

            message[colorOffset] = rBytes[0];
            message[colorOffset+1] = rBytes[1];
            message[colorOffset+2] = gBytes[0];
            message[colorOffset+3] = gBytes[1];
            message[colorOffset+4] = bBytes[0];
            message[colorOffset+5] = bBytes[1];

            if (changeDetector.hasChanged(x, y, r, g, b)) {
                outputStream.write(message);
            }
        }
    }
}
We are now deep in the territory of things I would never do in production code. But I guess we are just having fun, and since performance is the only goal, everything goes, even the mutation of the global state.
Replacing `println` with write eliminated the need for string manipulation, reducing the computational overhead. Precomputed byte arrays for coordinates and colors ensured efficient reuse of formatted data.
Using a `BufferedOutputStream` allowed for more efficient I/O by batching writes, minimizing the number of interactions with the underlying stream.
The frame rate saw another significant improvement, now comfortably exceeding 400 FPS, even in sections of the animation with higher pixel changes. The reduced overhead and increased efficiency eliminated any remaining noticeable latency, resulting in animation speed that is starting to be uncomfortable to look at.
Interlude: Benchmarking Beyond FPS
As the frame rate soared past 400 FPS in many parts, it became clear that measuring performance purely in frames per second was no longer sufficient. While FPS is a helpful metric for gauging playback smoothness at lower speeds, at this level of performance, it was starting to lose its relevance. To better understand and quantify the efficiency of the implementation, I turned to a more robust benchmarking approach using JMH.
What Is JMH?
JMH (Java Microbenchmark Harness) is a framework specifically designed for creating and running benchmarks in Java. Developed by the same team as the Java Virtual Machine, JMH accounts for critical factors that can distort benchmark results, such as JIT Compilation, Warm-Up Phases, and other factors less relevant to this project.
Why Tools Like JMH Are Important
Naive benchmarking approaches, such as measuring execution time with `System.nanoTime()` or `System.currentTimeMillis()` (or my previous FPS metrics), produce unreliable results.
Tools like JMH ensure accuracy by automatically handling the aforementioned warm-up phases, repeated iterations, and statistical analysis.
This makes benchmarks repeatable as long as the conditions stay consistent between runs.
A New Metric: Time to Stream the Video
Instead of relying on FPS, I decided to benchmark performance by measuring how long it takes to stream all 6,569 frames of Bad Apple to the Pixelflut server. This approach provides a clearer picture of overall throughput and avoids the pitfalls of using a moving average metric, like my previous FPS count, especially when frame rates are extremely high.
By using JMH, I was able to measure the time taken establishing a baseline for further optimizations.
The current scores are:
| Benchmark | Mode | Cnt | Score | Error | Units |
|---|---|---|---|---|---|
| bad apple | avgt | 25 | 21.780 | ± 0.415 | s/op |
Which indicates, that the average frame rate throughout the entire video was 6,569/21.780 ≈ 300 FPS.
Fifth Iteration: Switching to Java NIO
Looking at the current profiling information of the VisualVM we can see that the write function is the next major bottleneck of the application.

It is time to transition from traditional I/O to Java NIO. The Non-blocking I/O (NIO) API in Java is designed for high-performance data transfer. As a proof of concept, I started with a blocking `SocketChannel` and optimized the implementation by batching frame data into a single `ByteBuffer` before sending it over the network.
Implementation with Java NIO
The first step was to replace the `OutputStream` with a `SocketChannel` and manage data transfer using a `ByteBuffer`. Here’s the updated code:
try (var socket = SocketChannel.open()) {
socket.configureBlocking(true);
socket.connect(new InetSocketAddress("localhost", 1337));
//[...]
var writeBuffer = ByteBuffer.allocate(width * height * message.length);
//[...]
if (changeDetector.hasChanged(x, y, r, g, b)) {
    writeBuffer.put(message);
}
//[...]
writeBuffer.flip();
socket.write(writeBuffer);
writeBuffer.clear();
socket.socket().getOutputStream().flush();
Combining the entire frame into a single write operation significantly reduced the time spent on I/O.
While this implementation uses a blocking `SocketChannel` for simplicity, it makes way for further optimizations using non-blocking I/O in the coming iterations.
Let’s run the benchmark again and see how much things have improved.
| Benchmark | Mode | Cnt | Score | Error | Units |
|---|---|---|---|---|---|
| bad apple | avgt | 25 | 16.305 | ± 0.112 | s/op |
The time required to stream the entire video is now down to approximately 16 seconds! A quick look at the VisualVM profiling results confirms the `write` operation is no longer the system’s bottleneck:

While I’ll transition the `SocketChannel` to non-blocking mode for completeness, this change is unlikely to impact performance significantly, as the write operation is no longer a bottleneck. If you’re curious, you can check out the update on my GitHub repository. Instead, I’ll shift my focus to exploring a different area for potential improvement.
Sixth Iteration: Double Buffering and Multi-Threading
As performance improvements continued, the next step was to introduce double buffering and separate the tasks of filling and sending the buffer into two distinct threads. This approach allowed the application to prepare the next frame in parallel while the current frame was being sent, reducing the time spent waiting for I/O operations. An added benefit was the ability to analyze performance more effectively, as profiling now provided clearer insights into which thread was waiting more.
Implementing Double Buffering
Double buffering involved alternating between two `ByteBuffer` instances, with each buffer being managed by a corresponding lock to ensure thread safety. Here’s an outline of the changes:
var writeBuffers = new ByteBuffer[]{ByteBuffer.allocate(width * height * message.length), ByteBuffer.allocate(width * height * message.length)};
var bufferLocks = new Semaphore[]{new Semaphore(1), new Semaphore(1)};
var bufferFiller = new Thread(() -> {
//[...]
bufferLocks[frameBufferIndex].acquire();
sendChangedPixels//[...]
bufferLocks[frameBufferIndex].release();
//[...]
});
var writerThread = new Thread(() -> {
//[...]
bufferLocks[frameBufferIndex].acquire();
writeBuffers[frameBufferIndex].flip();
while (writeBuffers[frameBufferIndex].remaining() > 0) {
    socket.write(writeBuffers[frameBufferIndex]);
}
writeBuffers[frameBufferIndex].clear();
bufferLocks[frameBufferIndex].release();
socket.socket().getOutputStream().flush();
//[...]
});
This change impacted performance, though not by a significant amount, as expected:
| Benchmark | Mode | Cnt | Score | Error | Units |
|---|---|---|---|---|---|
| bad apple | avgt | 25 | 15.337 | ± 0.320 | s/op |
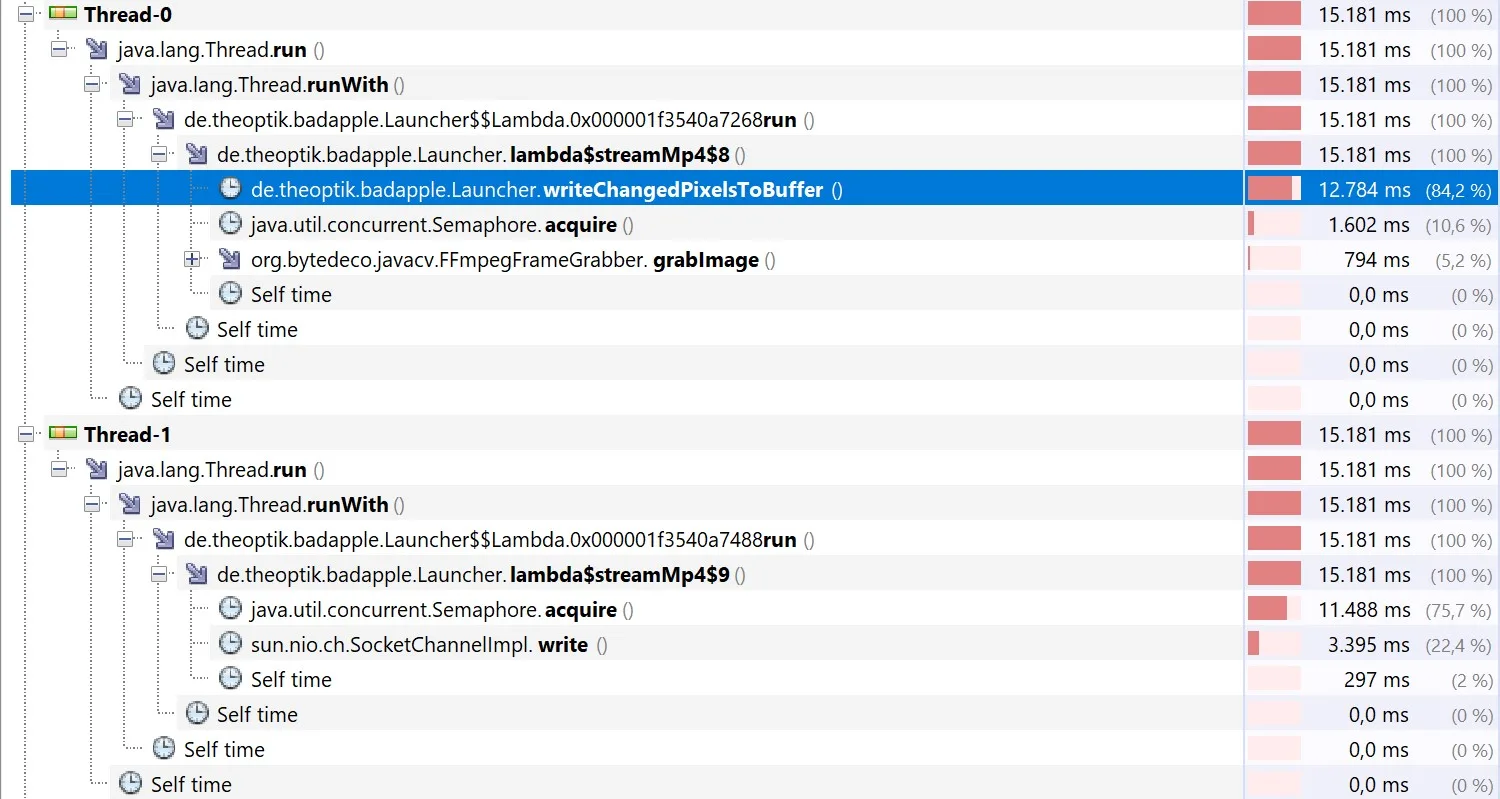
However, the profiling results now provide a much clearer picture of where time is being spent. It’s evident that writing pixels into the buffer is now the primary bottleneck. With this insight, it’s time to address that next!

Seventh Iteration: Parallelizing Buffer Filling
With profiling revealing that writing pixels into the buffer was the primary bottleneck, the next step was to parallelize this task. By utilizing an `ExecutorService`, the application could distribute the work across multiple threads, leveraging the full power of modern multi-core processors.
First, an executor is initialized with a thread pool. The number of threads in the pool was set to the number of available processors to maximize CPU utilization:
var processors = Runtime.getRuntime().availableProcessors();
var executor = Executors.newFixedThreadPool(processors);
Then the `writeChangedPixelsToBuffer` method was updated to return a list of `Callable` tasks, each responsible for processing a portion of the frame:
private static List<Callable<Void>> writeChangedPixelsToBuffer(/* parameters */) {
    return () -> {
        // Logic to divide work into tasks
        if (changeDetector.hasChanged(x, y, r, g, b)) {
        synchronized (writeBuffer) {
            writeBuffer.put(messageCopy);
            }
        }
        //[...]
    }
}
The tasks are then submitted to the `ExecutorService` for parallel execution. The `invokeAll` method ensured all tasks were completed before proceeding:
var tasks = writeChangedPixelsToBuffer(/* parameters */);
for (var future : executor.invokeAll(tasks)) {
    future.get(); // Ensure each task completes
}
Parallelizing the buffer-filling operation reduced the time spent on this task, especially for frames with high pixel changes. However, the approach didn’t scale as effectively with the number of available CPU cores as expected, primarily because writing to the buffer remained synchronized.
| Benchmark | Mode | Cnt | Score | Error | Units |
|---|---|---|---|---|---|
| bad apple | avgt | 25 | 14.788 | ± 0.352 | s/op |
Additionally, the lack of sequential writes to the frame buffer introduced severe screen-tearing, as entries were no longer written in order.
While this iteration brought some improvements, it also highlighted new challenges that need to be addressed.
Final Iteration (for now): Local Buffers for Parallel Tasks
To address the limitations of the previous iteration, the application was updated to use a local buffer for each task. This change eliminated the need for synchronized writes to a shared buffer and ensured that frame entries remained in order. By isolating each task’s writes, the application not only improved scalability but also resolved the screen-tearing issues observed earlier.
Implementing Local Buffers
Each task was assigned a dedicated buffer, splitting the capacity of the shared frame buffer equally among all tasks. Using `ByteBuffer.allocateDirect` ensured optimal performance for direct memory access:
var localBuffers = Stream.generate(() -> ByteBuffer.allocateDirect(writeBuffers[0].capacity() / processors))
    .limit(processors)
    .toArray(ByteBuffer[]::new);
Each task writes to its assigned local buffer, ensuring no synchronization is required:
if (changeDetector.hasChanged(x, y, r, g, b)) {
    localBuffers[yChunk].put(messageCopy);
}
Once all tasks are completed, their local buffers are flipped and appended to the shared frame buffer in sequence:
for (var future : executor.invokeAll(tasks)) {
    var localBuffer = future.get();
    localBuffer.flip();
    writeBuffers[frameBufferIndex].put(localBuffer);
    localBuffer.clear();
}
Using local buffers ensured that entries in the frame buffer were written in order, eliminating the screen-tearing observed in the previous iteration.
By removing the need for synchronized writes, the application now utilized CPU cores more effectively, scaling better with the number of available processors.
The switch to local buffers and direct memory allocation further reduced the time spent preparing each frame, achieving the best performance yet.
… Or so I Thought!
| Benchmark | Mode | Cnt | Score | Error | Units |
|---|---|---|---|---|---|
| bad apple | avgt | 25 | 14.698 | ± 0.102 | s/op |
While the screen tearing did indeed disappear, performance was virtually identical to the previous solution.
But this time, the problem was of a different nature.
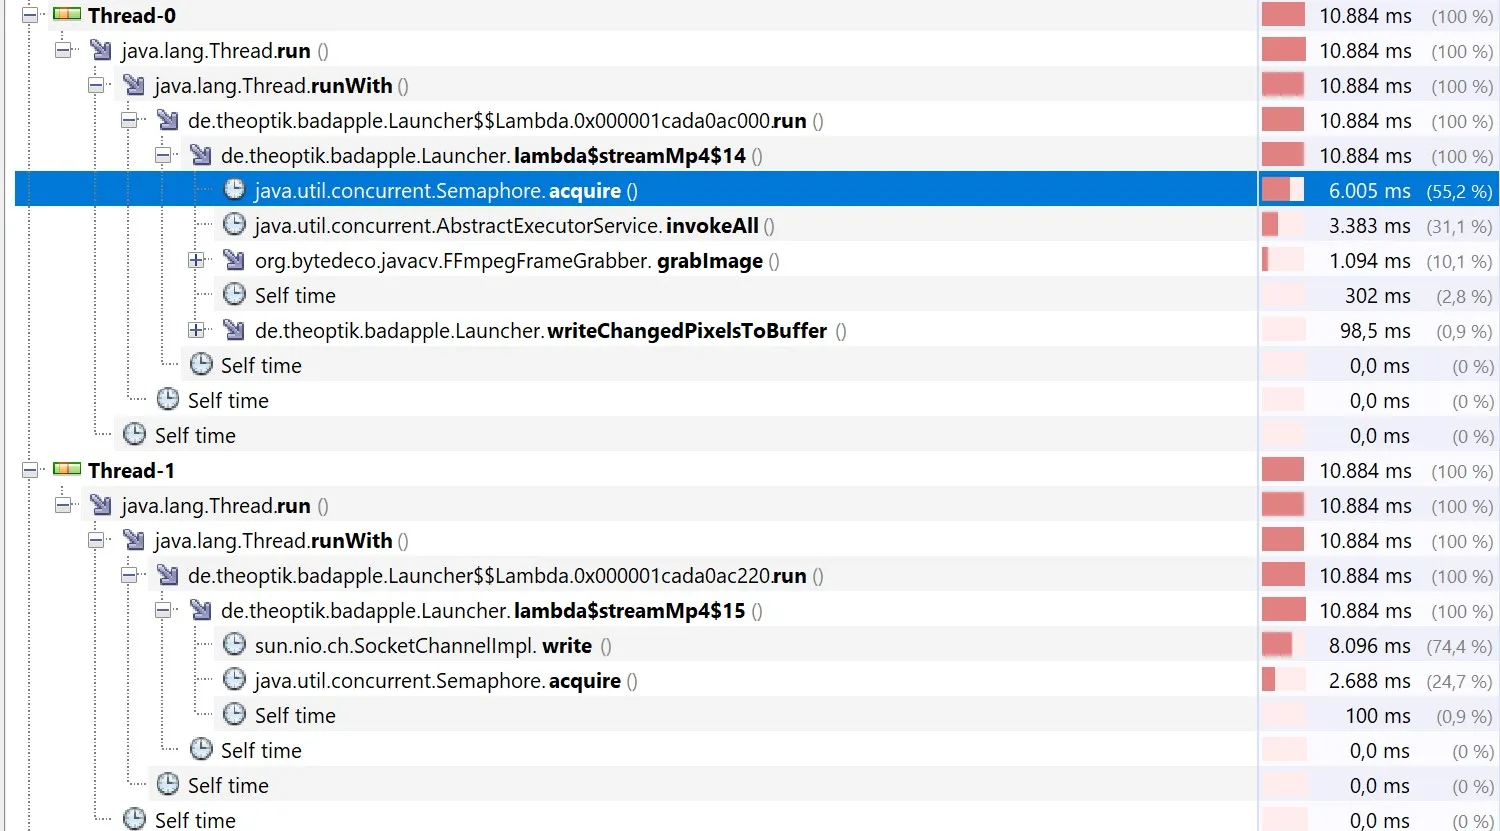
So far, we have been able to optimize our application continually to improve performance. But the current profiling information shows the majority of the time is spent waiting for the server to acknowledge our write operation:

The End?
Looking at the initial and final implementations side by side, we see how far the project has progressed in terms of throughput.
Maybe in the future I will revisit this project and try to get even more performance out of it than I do now.
Using a more powerful machine or tweaking with the server code might be needed to get more than just slight performance improvements.
Thank you for reading, it’s been a blast to write the code and this blog post. If you have any suggestions or questions feel free to contact me or open an issue/PR on the repository.


Schreibe einen Kommentar