When it comes to mobile testing, we need to talk about testing on real devices. What seems to be an easy task for the tester, could be hard when you try to debug device specific errors on the device itself.
This short guide will help you with the setup of the remote debugging with the Safari Developer Tools. It is easy as counting to three, but you need to find the right settings.
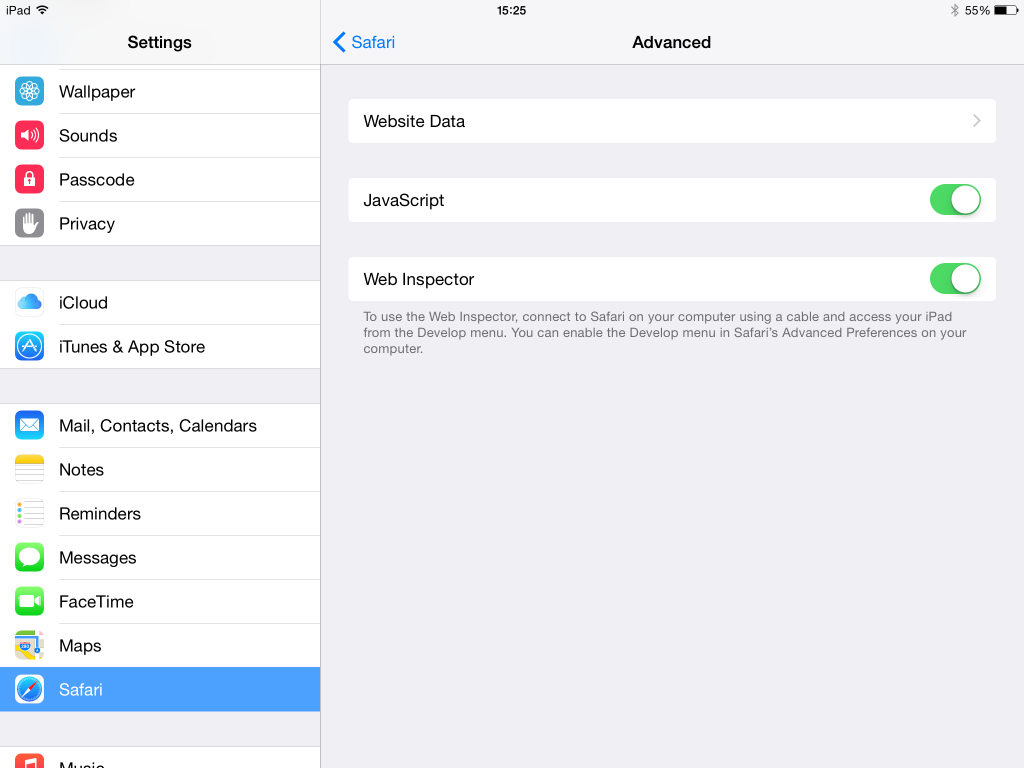
First, we need to activate the „Web Inspector“ on the device itself. Just navigate to Settings – Safari – Advanced Settings and activate the „Web Developer“ setting.

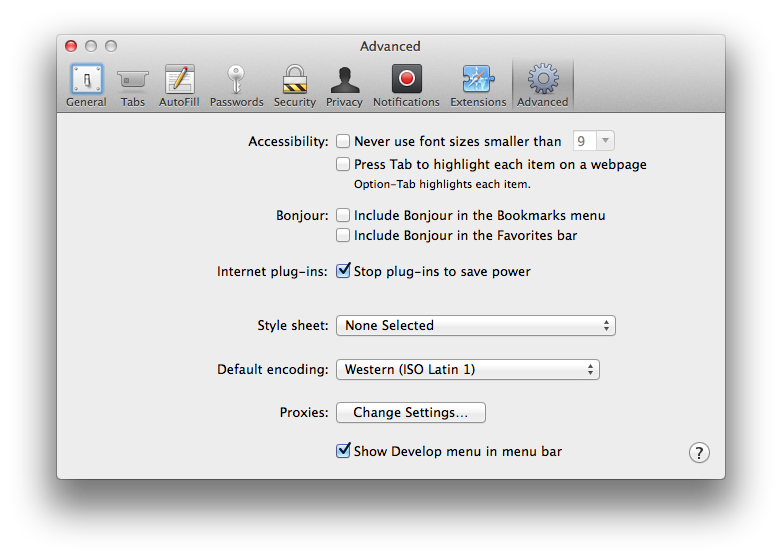
To connect your device and your local development computer, you have to rely on Apples Safari Browser. By default the „Developer Mode“ is disabled, so we need to enable it in the Advance-Tab on the settings screen. Just tick the „Show Develop in menu bar“ option.

With „Developer Mode“ activated we will see a new topic in the Safari menu, called Developer.
To start the remote debugging on the device, just open your website on the device with the Safari browser. Currently, it is not possible to remote debug in other browsers on the device.
After navigating to the page on the device, click on the Developer menu item on your development machine and your remote device should be visible in the menu (f.e. „My first iPad“). In the opening submenu, you will see the open tabs on the device. Click on it and the „Developer Console“ will open and you can start debugging.
Happy debugging!


Schreibe einen Kommentar