Over the years, PHP has evolved from a script language to a programming language used in big applications with high-level architectures.
As the most popular language for web applications, PHP is very fast, robust and stable by default.
Coming from tiny scripts, PHP is used in large-scale web applications nowadays.
In terms of business context, we need to focus on these three key factors:
- Scalability
- Responsiveness
- Resource misusage
All three factors have a high impact on hardware costs, customer loyalty and – indirectly – sales.
As an example, good responsiveness increases the mean residence time of customers on a certain webpage and therefore improves customer loyalty and satisfaction.
In addition, all the factors can be improved by optimizing the code of an application.
So on the technical side, we need to cover CPU time, memory usage and execution time.
Without profiling, every application has room for improvement of about 80-90 percent.
So the question is, how to optimize the code?
Reducing resource limits in PHP can produce unspecific error messages and nebulize the origin of a problem.
Some examples:
Fatal error: Allowed memory size of 8388608 bytes exhausted (tried to
allocate 134 bytes) in Unknown on line 0
Fatal error: Maximum execution time of 30 seconds exceeded in
/var/www/magento/lib/Zend/Db/Adapter/Pdo/Abstract.php on line 134
Using network tools like Apache ab or Firebug often look promising, but instead of using real use cases, they only benchmark single requests with a high cache hit rate.
Therefore they don’t reflect real-world scenarios and optimizations won’t cover real bottlenacks.
So we need to create a request model which is pretty close to the real consumer behavior.
The more closer we get with this model, the better will be our optimizations.

Using the right environment should be also an important element in our performance measure concept.
Starting profiling from an IDE on a development system will not show bottlenecks appearing on a production system with some thousand users.
This is due to the fact that there is always a big delta bewteen development and production environments in terms of user interactions.
So all assumptions and optimizations made on a developement environment don’t represent the real world and cannot be used in other environments.
In addition, doing wrong or unnecessary optimizations will be time-consuming and expensive.
So the basic conditions in our testing lab should be as close as possible to the real world.
Seeing web applications becoming more and more business critical,
we’ve created a new approach which uses real-world scenarios to identify and eliminate system bottlenecks in an easy way.
Kurze Unterbechung
Das ist dein Alltag?
Keine Sorge – Hilfe ist nah! Melde Dich unverbindlich bei uns und wir schauen uns gemeinsam an, ob und wie wir Dich unterstützen können.
HowTo find bottlenecks in the code?
We assume that we don’t need to optimize every part of our application.
Instead we only optimize a small number of bottlenecks in order to improve the performance of the whole application
and get the best long term benefit out of it.
So we need to identify bottlenecks in the PHP code by running performance tests in combination with profiling.
The examples cover PHProjekt 6, which was rewritten from scratch, running in a virtual machine.
There are 5 steps:
-
To identify the bottlenecks, we reproduce real user interactions with the system on a reference environment.
These user interactions can be determined by using access logs or click path analytics.
Our test scenario should reflect the most important user actions rated by the frequency in the access log. For example:Access log analysis -
To perform the profiling we use JMeter in combination with our extended version of XDebug.
JMeter helps us to run a model of user requests which is very close to the real consumer behavior.
So all our assumptions and optimizations will be representable in the real world.
In the first step we identify the maximum number of parallel users by checking against a pre-defined level of responsiveness.
With the second step we determine the average responsiveness under a normal daily operation. In this step we also activate the profiling function of XDebug and append all profiles to one file. -
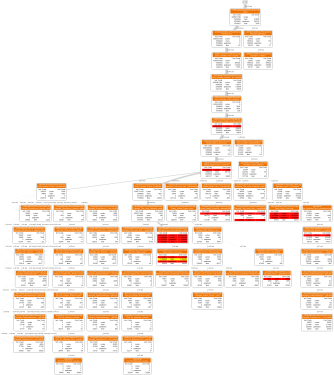
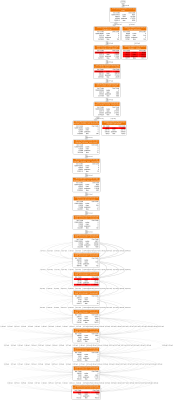
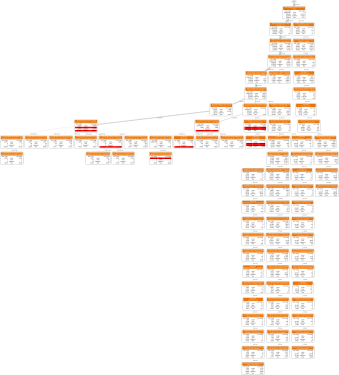
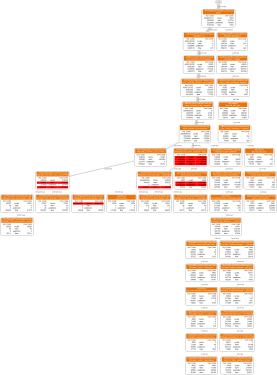
Afterwards we highlight the bottlenecks by processing the XDebug profile with PHP_CachegrindParser. For example:
Request flow over #108 requests (overall picture of our application)
-
Next we assign use cases to the bottlenecks.
Different optimization strategies can can be evaluated by comparing optimization costs with financial impacts.
Finally, the potential for improvement is weighed against optimization costs to find the priority of a bottleneck.
The result is a report showing bottlenecks in combination with affected use cases, optimization strategies and priorities:Bottleneck report - Then we implement our optimizations and repeat the profiling. That way we can directly verify the success of our solution.
Using these 5 steps, we can quickly analyze cpu usage, execution time and memory usage.
We only use real-world scenarios and our optimizations cover technical and financial aspects.
In addition, we can improve our software architecture and increase customer satisfaction.
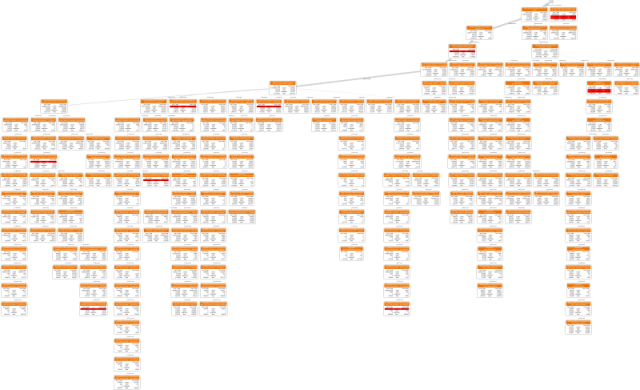
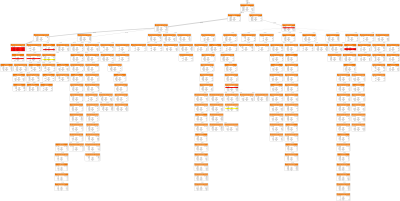
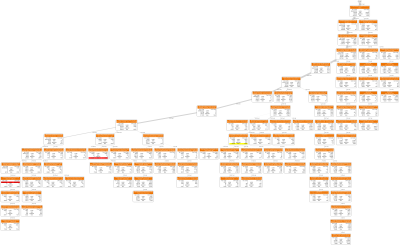
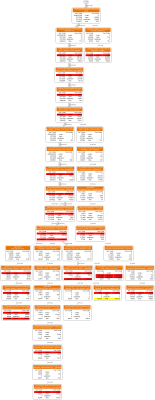
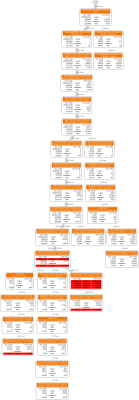
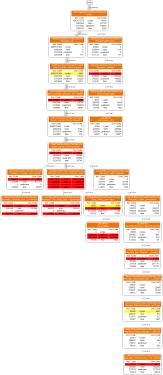
Appendix: Each request analyzed separately (
Show appendix,
Hide appendix
)





Schreibe einen Kommentar