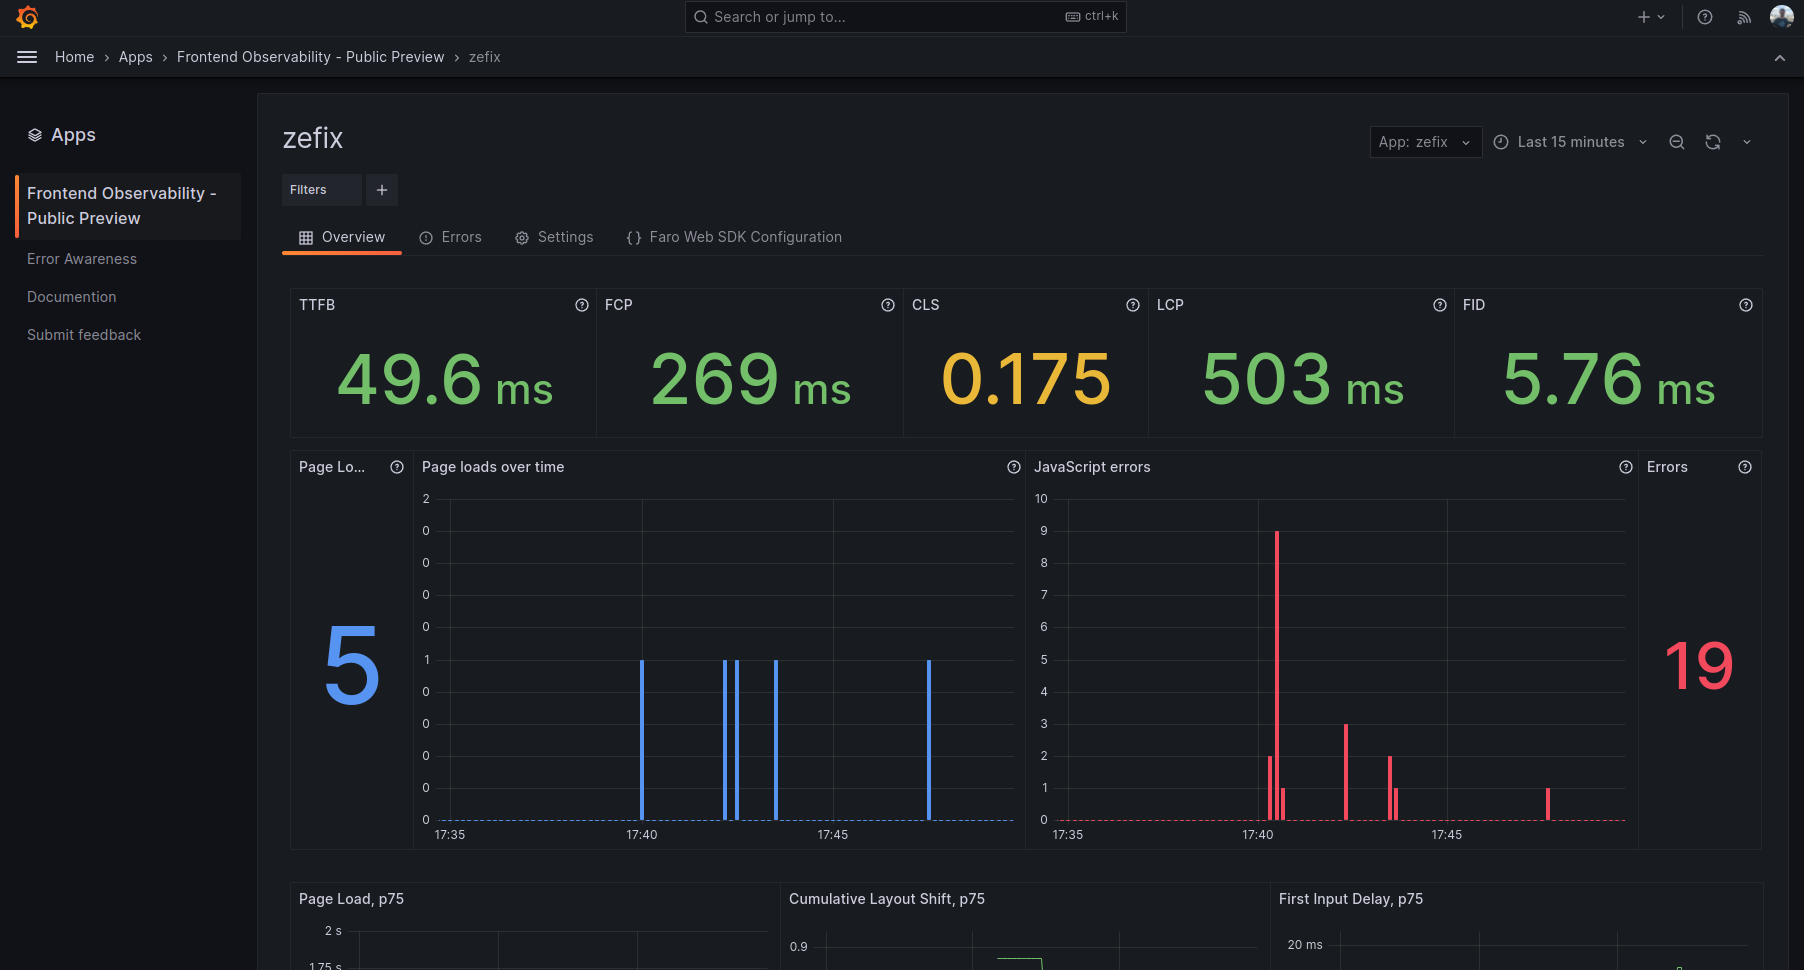
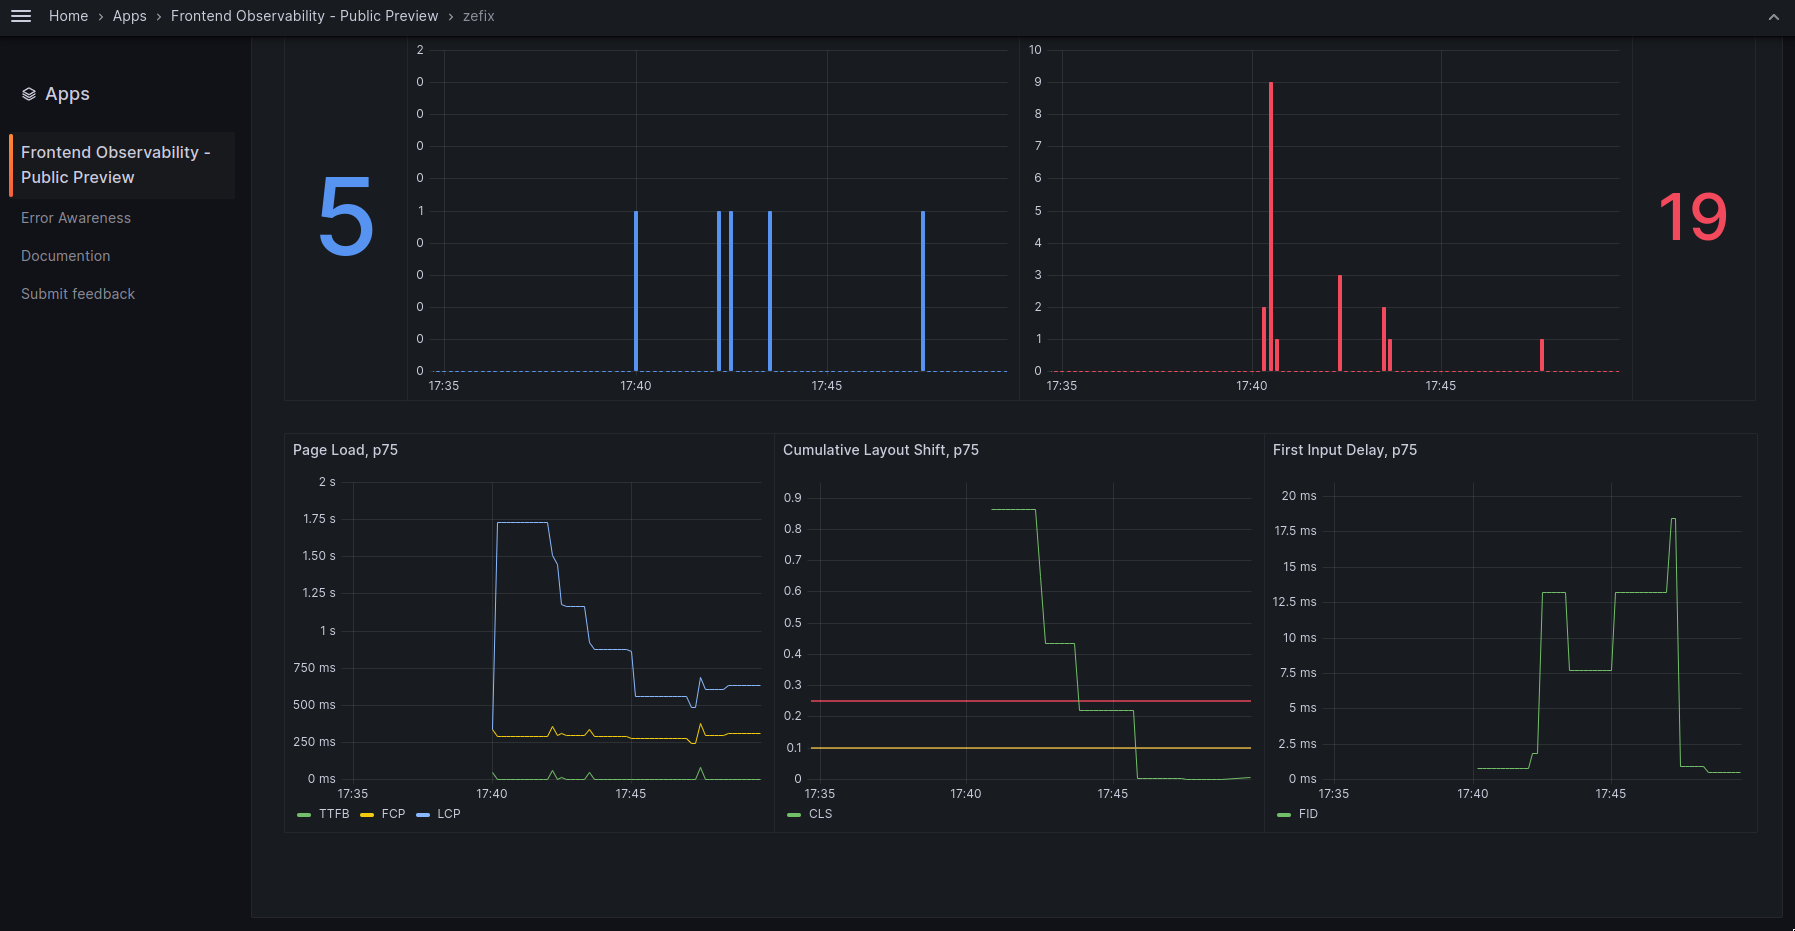
Grafana Faro is a JavaScript library that allows its users to observe the frontend of their web application using the Grafana stack (Tempo, Loki, Grafana). The receiving endpoint and related dashboards are also newly available in the Grafana Cloud offering as a public preview since 24th April 2023, called Frontend Observability.
Observability
The concept of improving visibility into the inner workings of the code at runtime is generally called observability. It is especially relevant in a complex architecture comprised of services by multiple teams. Commonly, it is composed of the following three pillars:
- metrics – time series data in numeric representation
- logs – single events with metadata
- traces – tracking duration between events, can be nested
OpenTelemetry is a standard for tracing and connecting traces for observability across services, including frontend to backend. OpenTelemetry also provides a protocol, a collector, instrumentations, and an SDK in order to allow the standard to be used among a variety of languages, libraries and environments.
The standard allows connecting the data collected using Grafana Faro to other observability data of backend services, especially frontend requests sent to APIs. Generally, it is easier to gain visibility into the backend services due to them running on hardware accessible to the developers, e.g. viewing the logs directly on the file system. Other modern tools are also mostly geared to gather data from backend services. Grafana Faro, released in November 2022, improves the situation for the frontend, and is now also available as a public preview in Grafana Cloud.
Faro Instrumentations
The Grafana Faro library gathers data in the frontend using the instrumentations explained below. Once the necessary data is collected, the Grafana Faro Web SDK sends it to the Grafana Agent, where the data is classified into logs, exceptions, events, measurements, and traces.
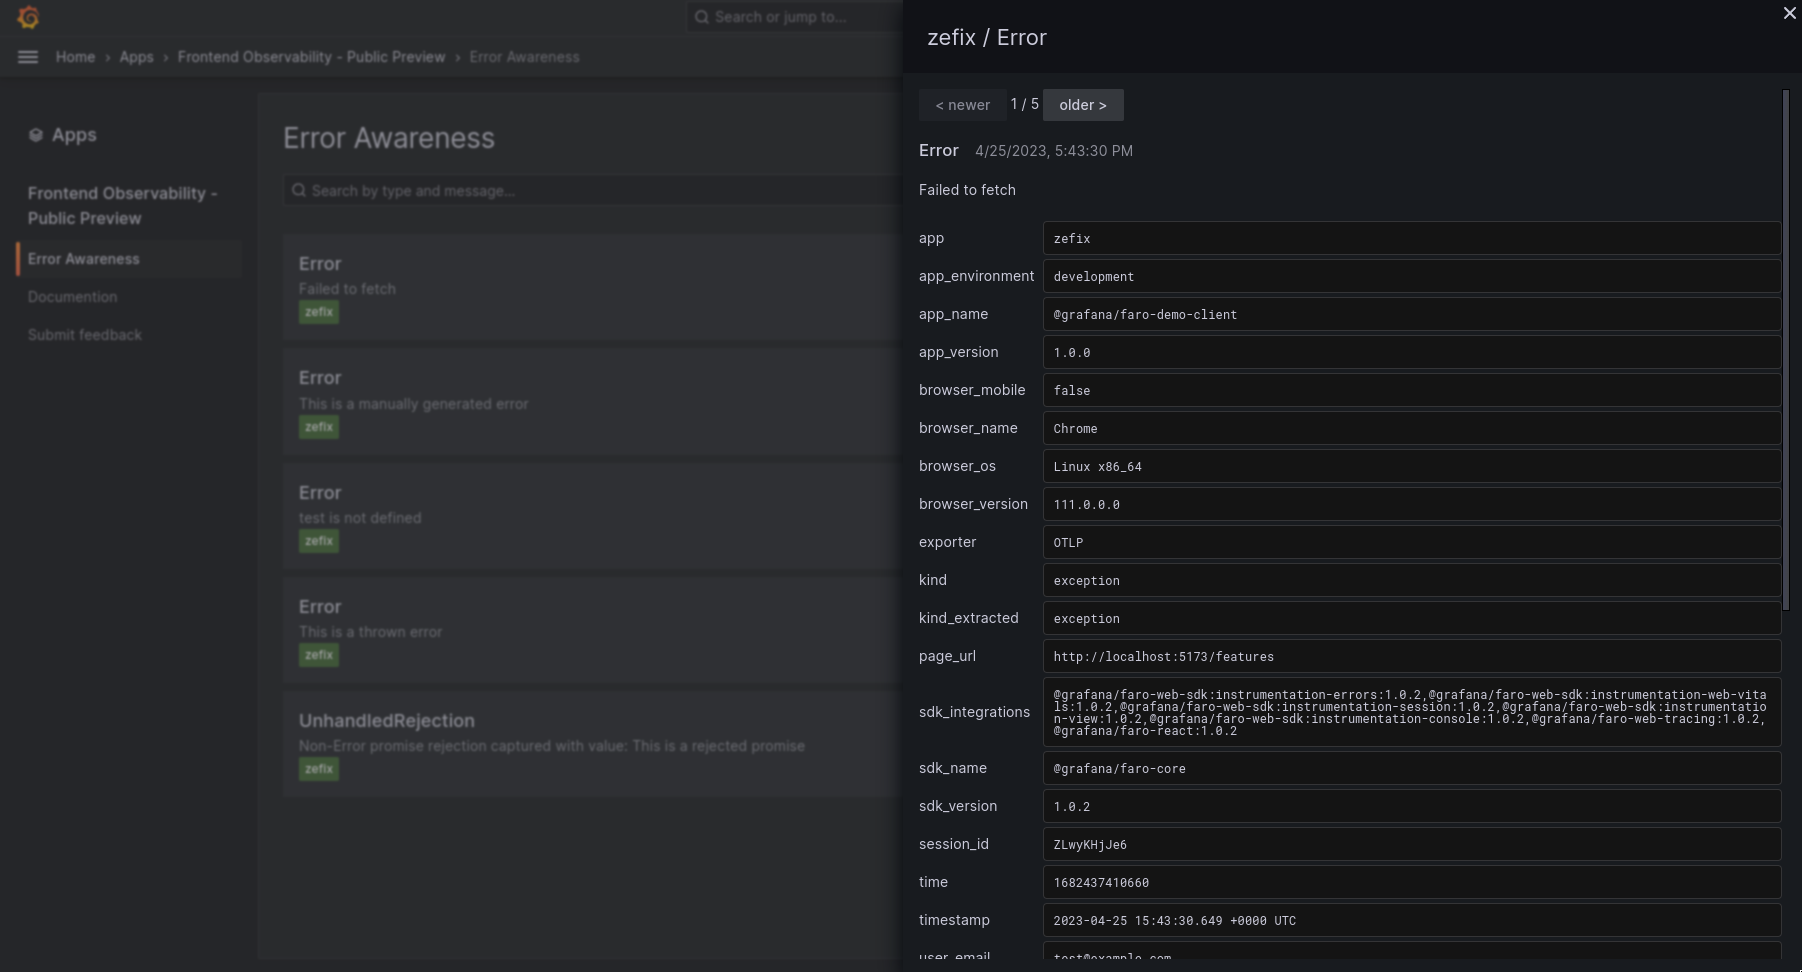
Next, Grafana Agent sends the data to Loki and Tempo, respectively. To Tempo, the traces are sent using the OpenTelemetry Protocol (OTLP), whereas logs, exceptions, events and measurements are saved in Loki, enriched with additional metadata.
Kurze Unterbechung
Das ist dein Alltag?
Keine Sorge – Hilfe ist nah! Melde Dich unverbindlich bei uns und wir schauen uns gemeinsam an, ob und wie wir Dich unterstützen können.
However, the tracing data can also be sent to other OTLP servers like jaeger. In this case, the user would either need to use a plugin to view the data in a Grafana Dashboard or just view it in jaeger.
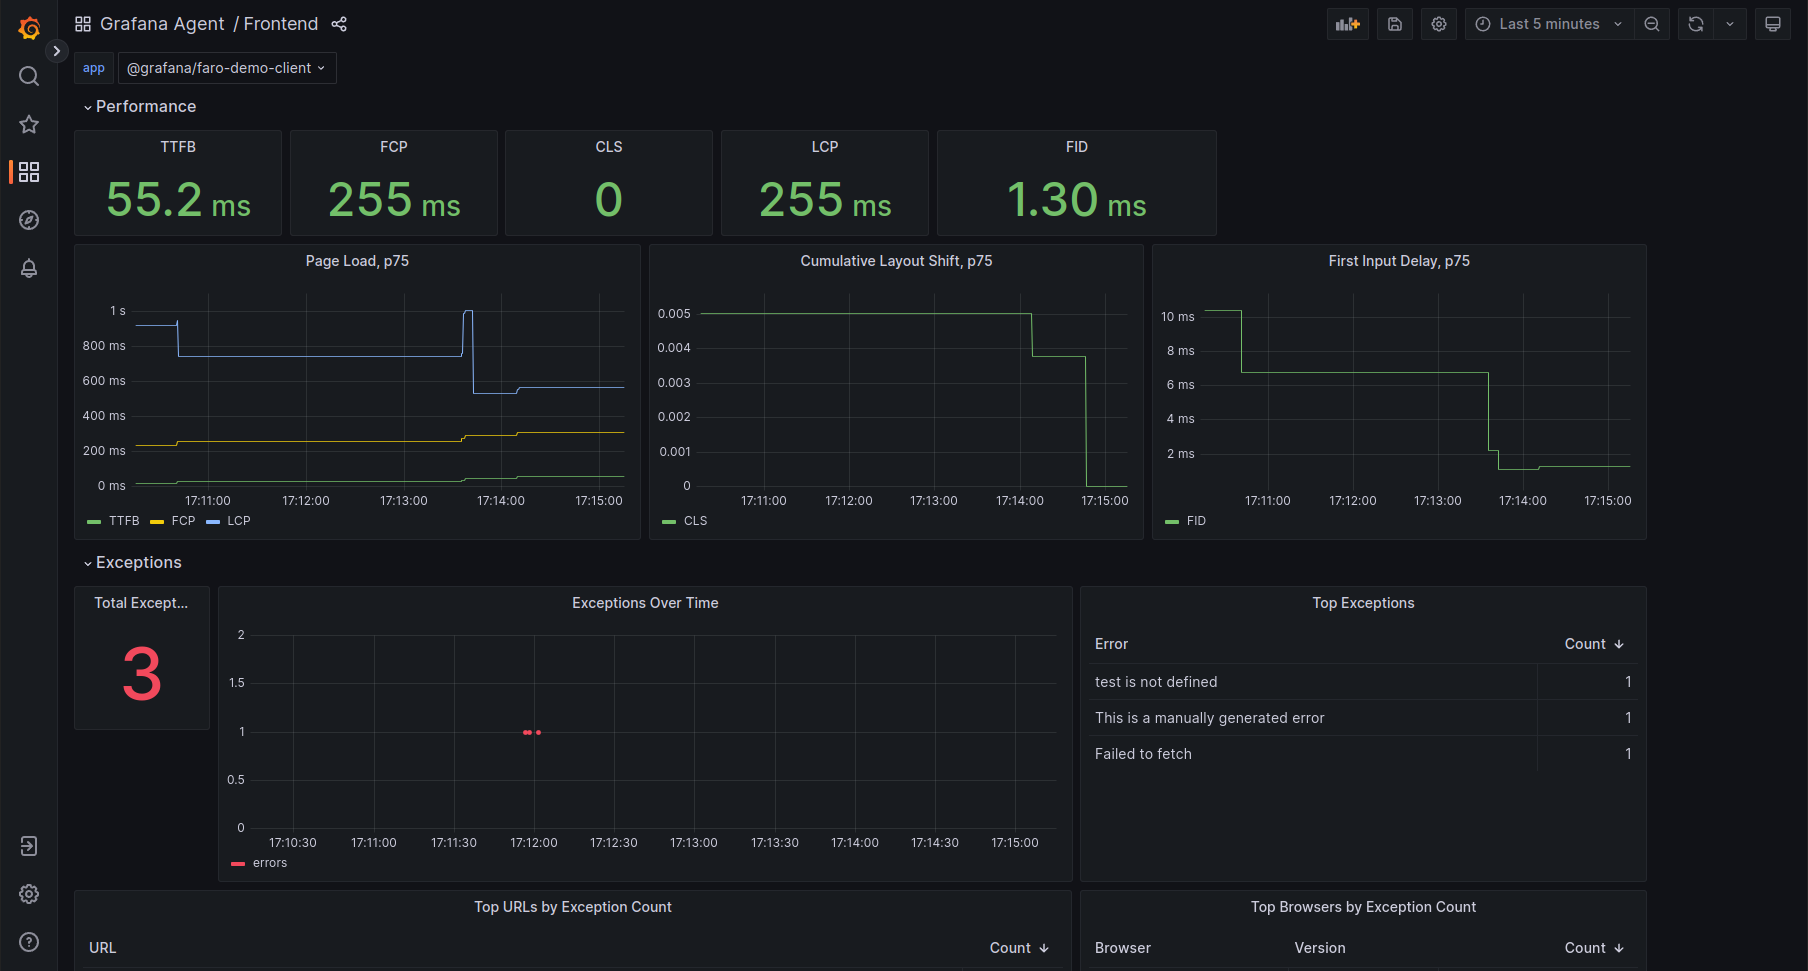
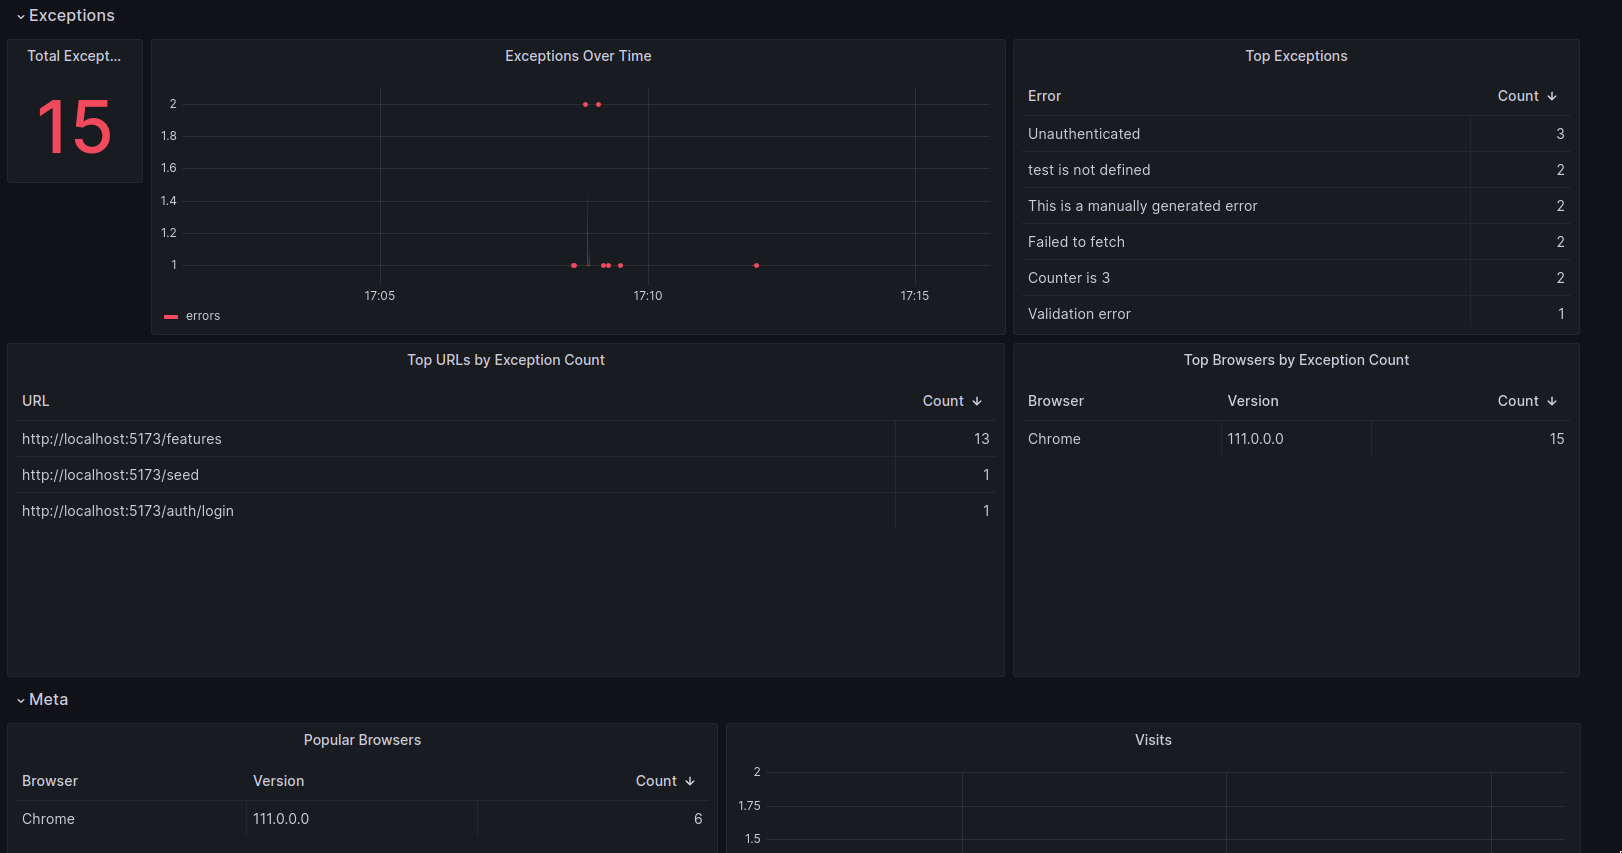
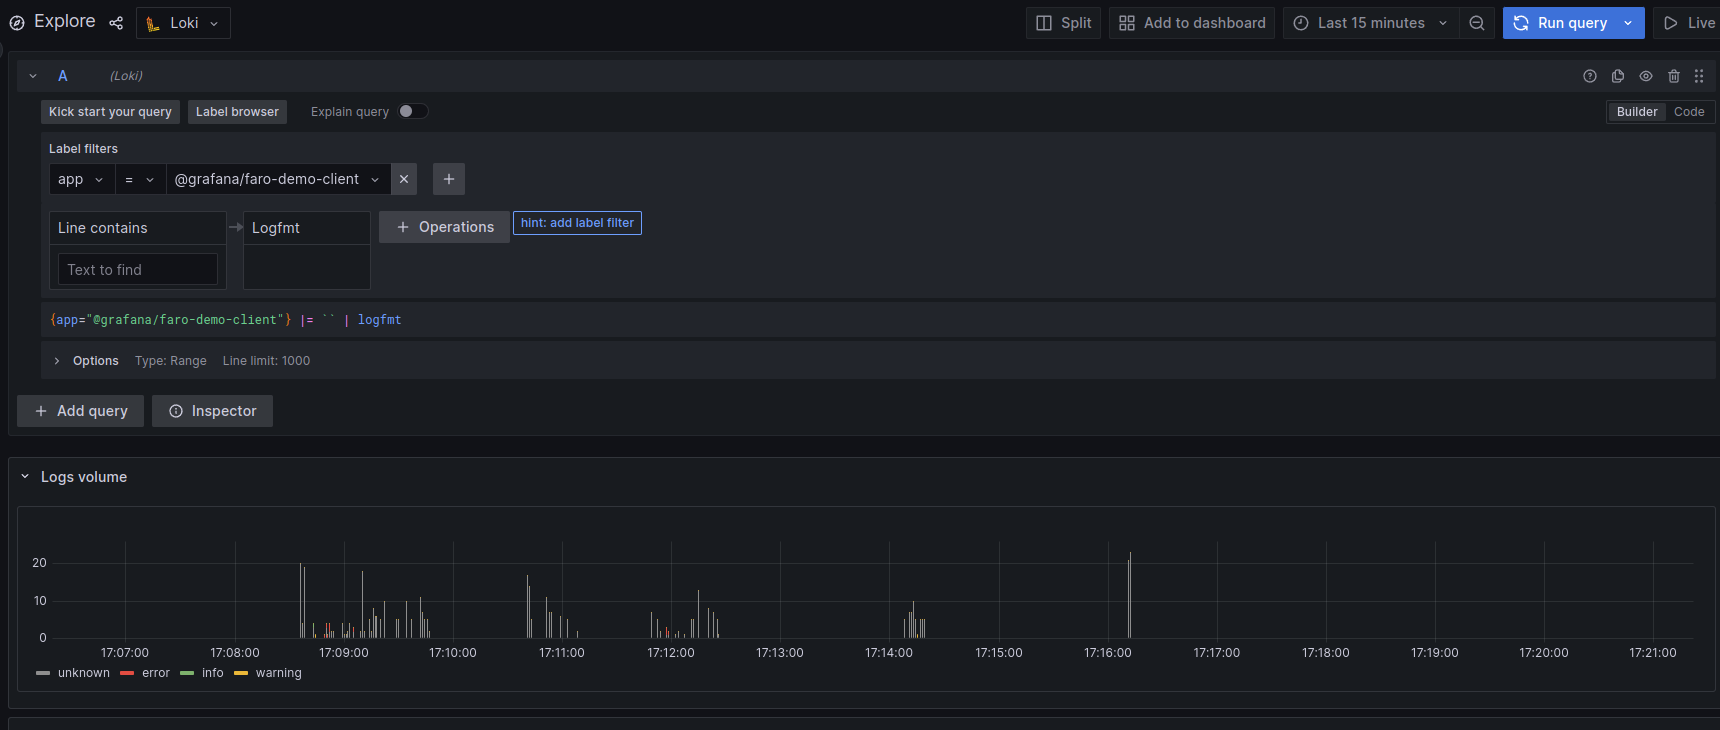
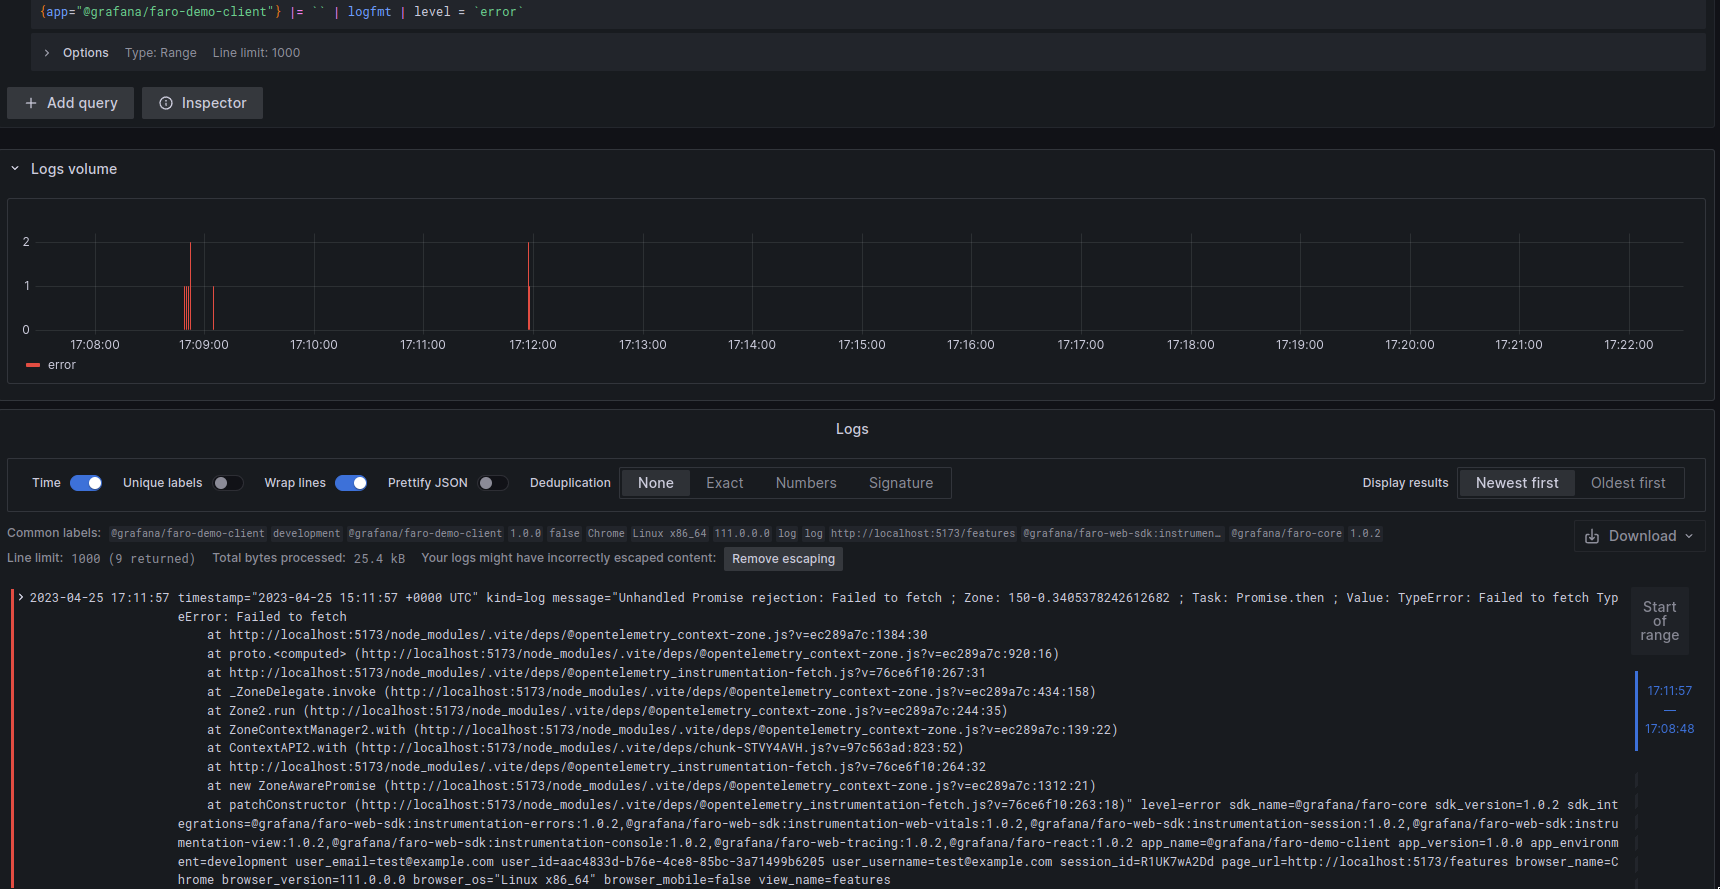
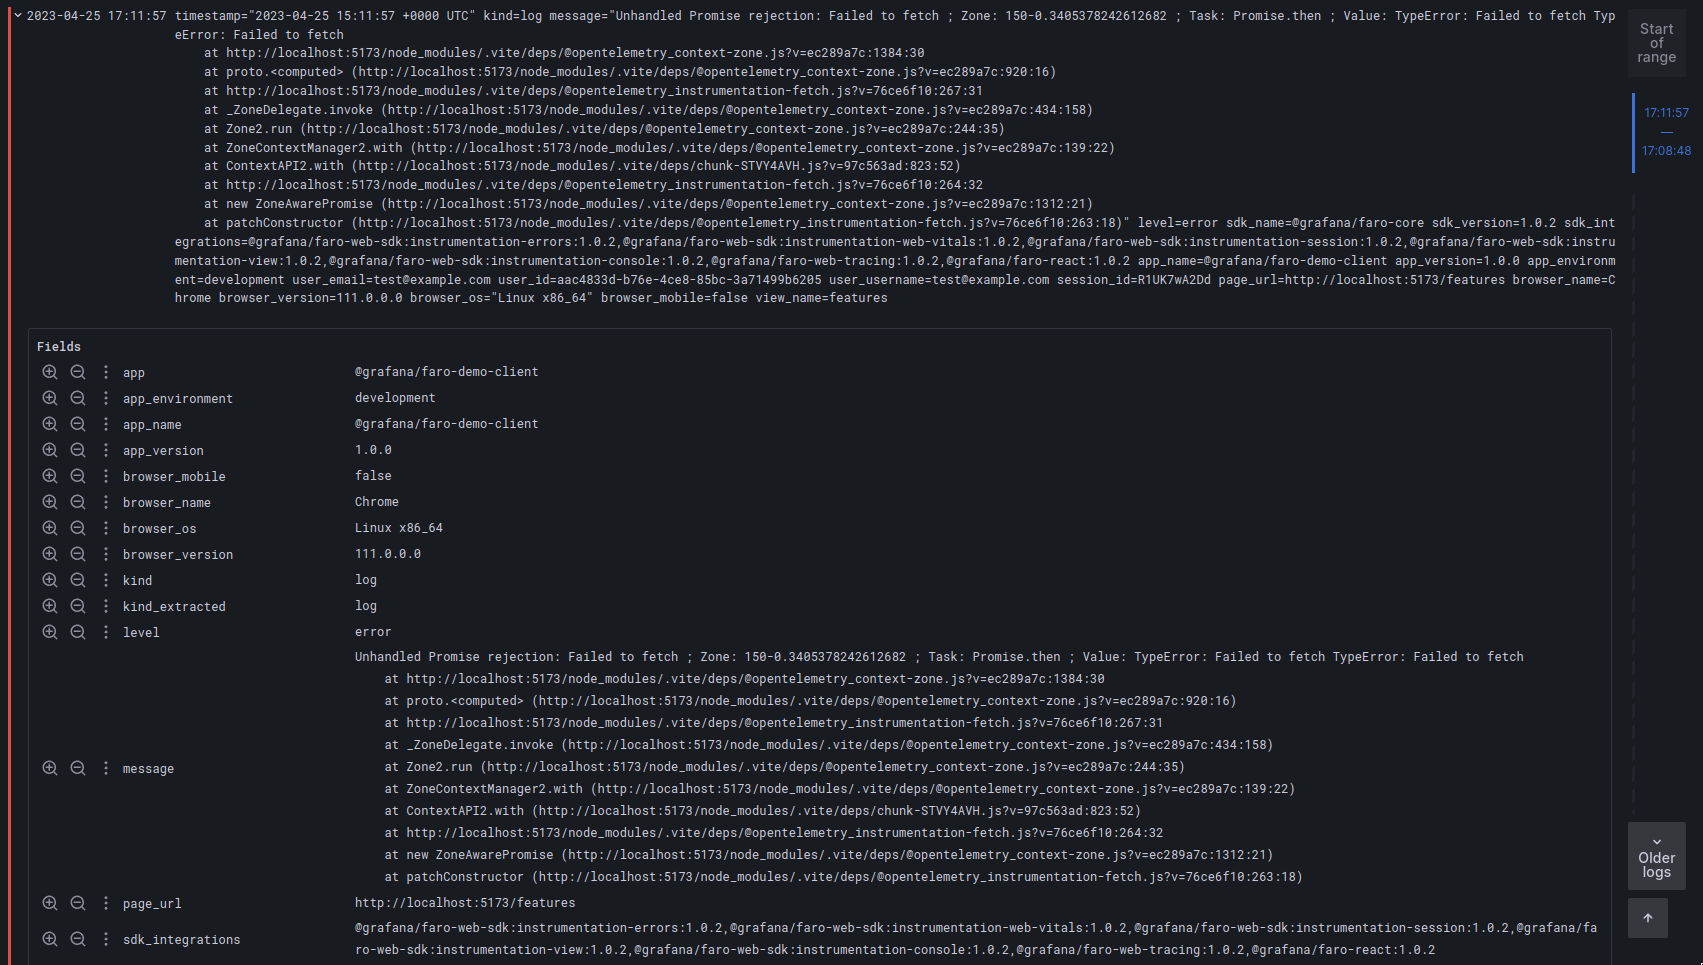
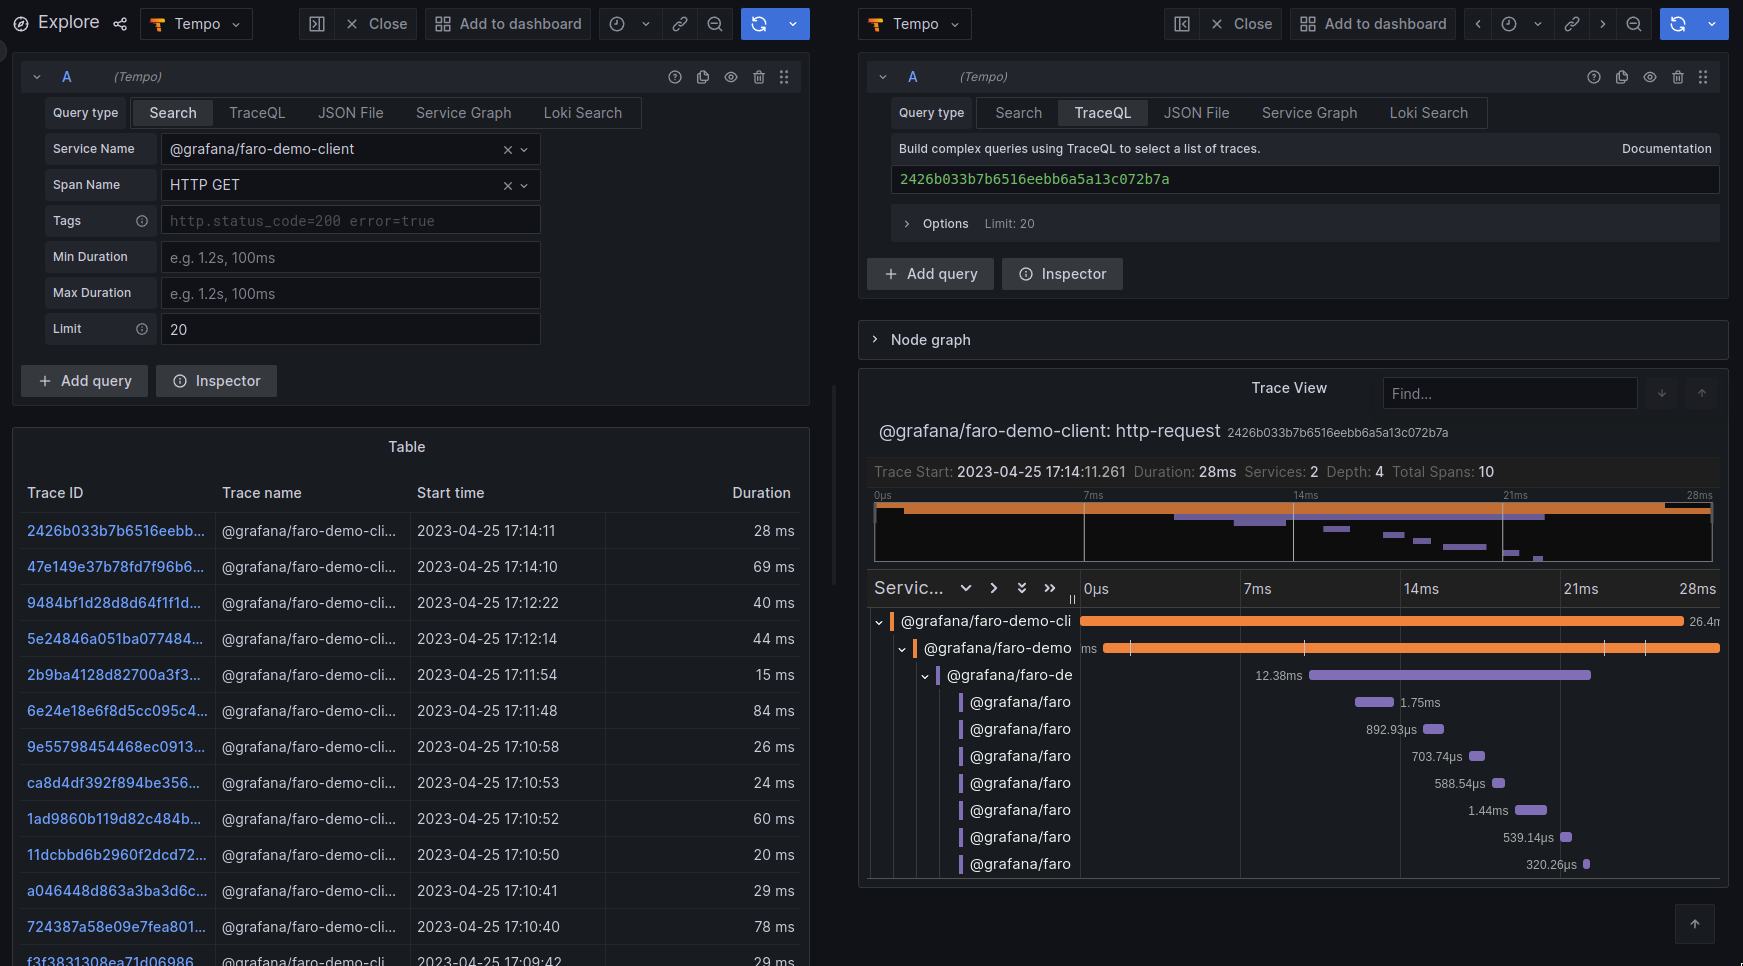
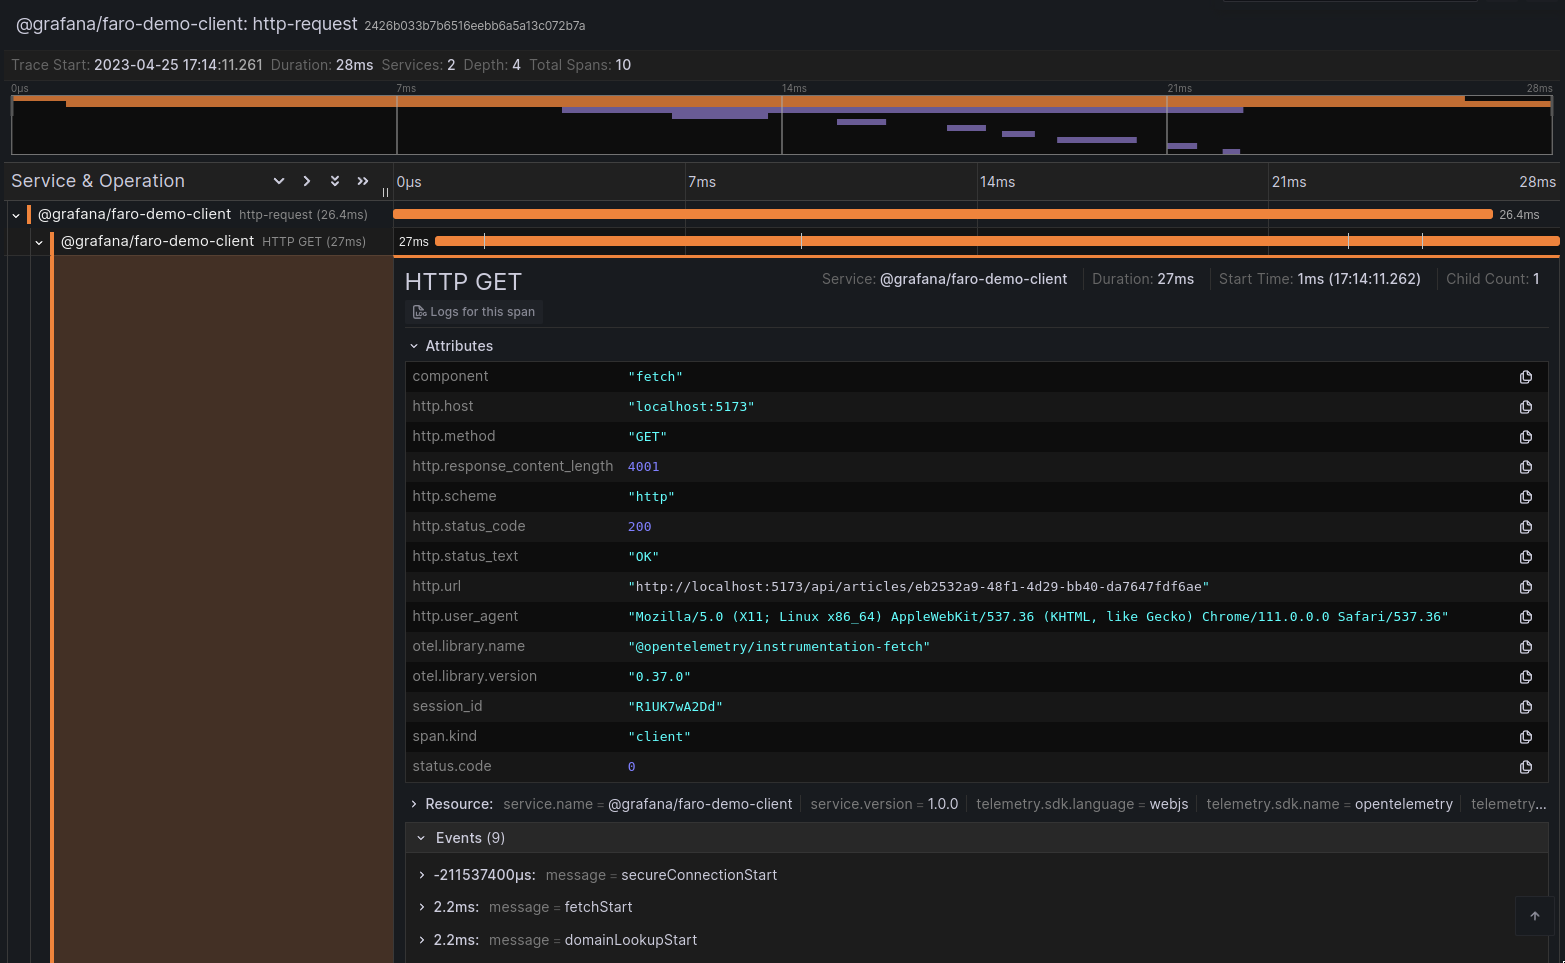
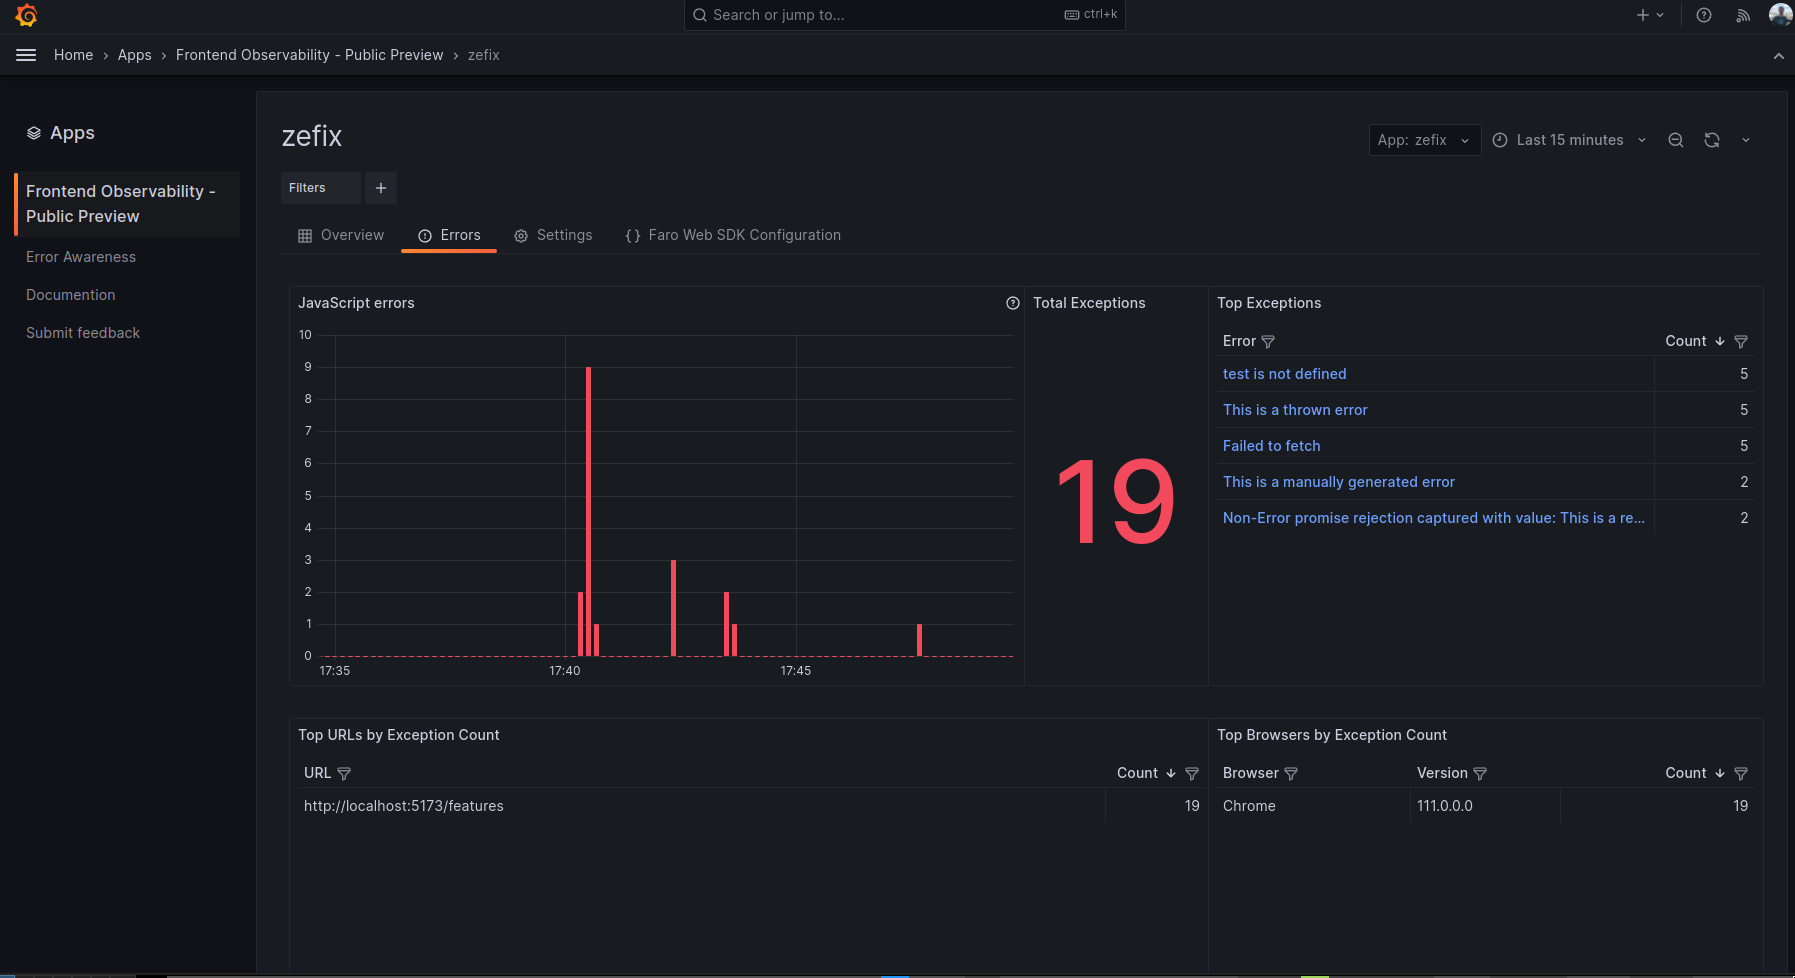
When the data is saved in Loki or Tempo, Grafana can be used to simply query the data and view it in dashboards or using the “Explore” feature.
The following instrumentations are available to observe the frontend:
- The console instrumentation collects logs depending on the activated log level filter (debug, error, log).
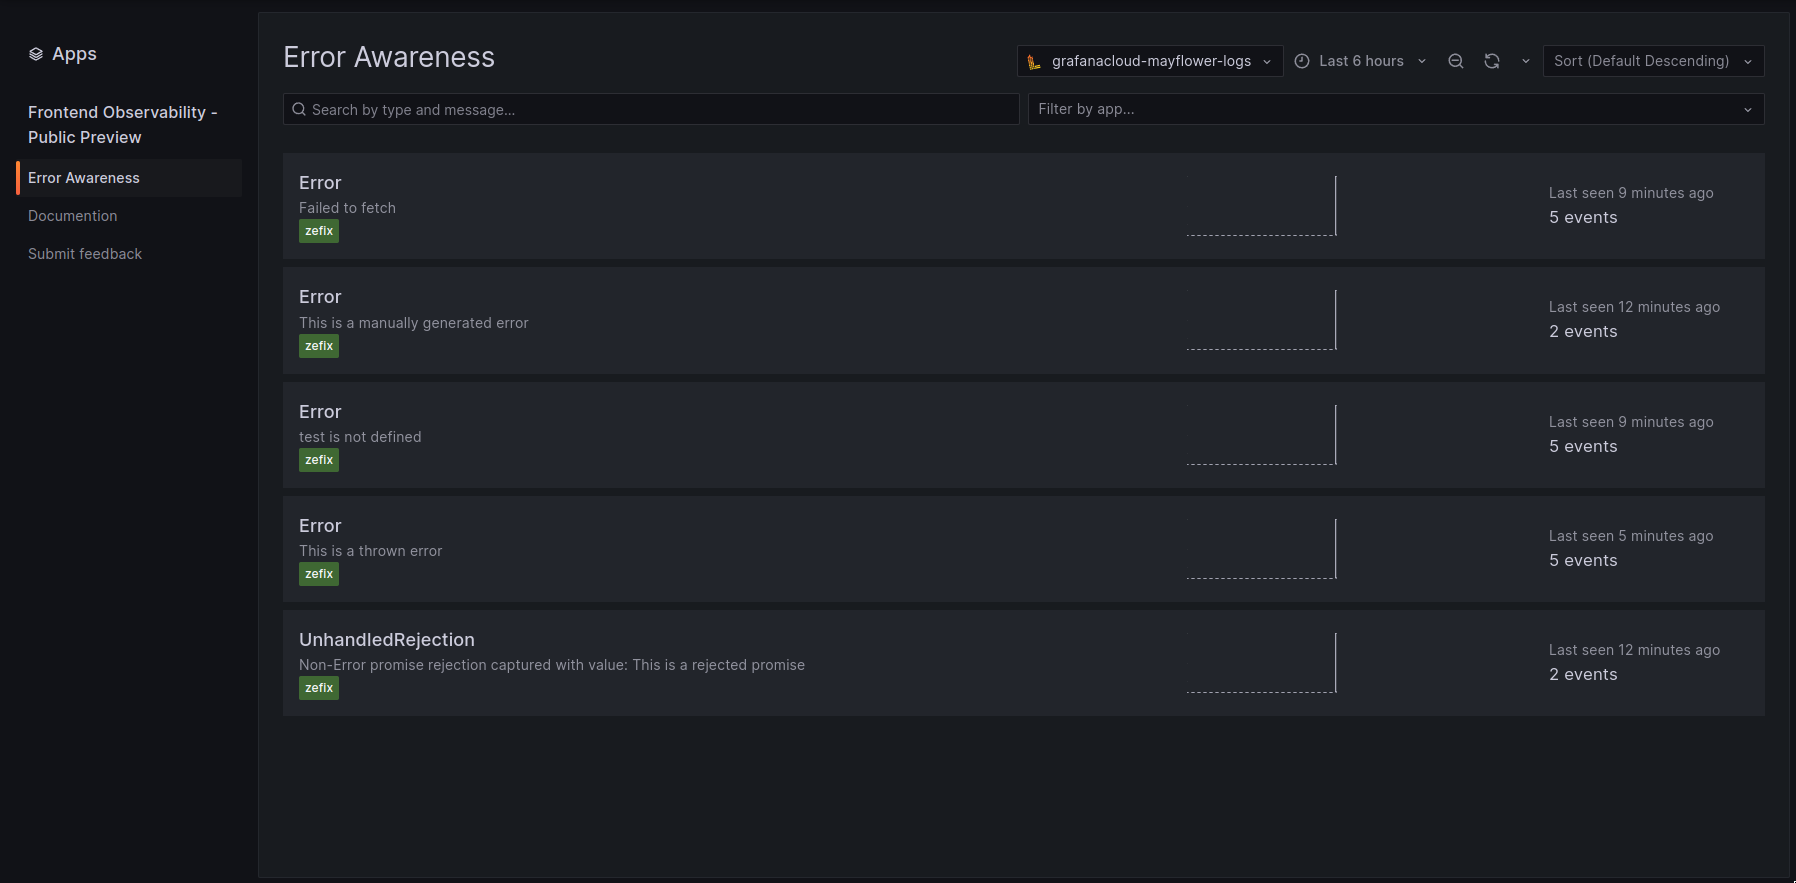
- The error instrumentation collects uncaught errors, extracts their stacktrace if available and reports them to the server.
- The Web Vitals instrumentation measures the real-world performance of the site in the browser so that the user experience can be improved.
- The session tracking instrumentation helps to correlate errors, logs and events occuring for a particular end-user during a single session in the application.
- The view tracking instrumentation helps to correlate errors, logs and events occuring in a particular section of the application.
Tracing
When an end-user interacts with an application, the tracing instrumentations measure the duration and collect metadata of events that are triggered in the browser.
The default instrumentations for tracing are:
- The user interaction instrumentation records the duration of the triggered event, what kind of user interaction took place and which elements were involved.
- The document load instrumentation measures the time a webpage takes to initially fetch its static resources.
- The fetch instrumentation measures the time a response takes to be delivered to the request using the Fetch API.
- The XMLHttpRequest instrumentation measures the same parameter as the fetch instrumentation does, with XMLHttpRequest being the older version of the Fetch API.
The following code illustrates, how to configure the standard instrumentations, including tracing.
import {
  getWebInstrumentations,
  initializeFaro,
  LogLevel,
} from '@grafana/faro-web-sdk';
import { TracingInstrumentation } from '@grafana/faro-web-tracing';


const faro = initializeFaro({
  url: 'https://agent.example.com/collect',
  instrumentations: [
    ...getWebInstrumentations(),
    new TracingInstrumentation(),
  ],
  app: {
    name: 'example-frontend',
    version: '1.0.0',
  },
});
React Integration
To observe React frontends more deeply, developers can use the React integration by simply adding a few lines of code. The React integration provides the following features:
- The Error Boundary surrounds certain components and delivers the stacktrace for unhandled errors in those components. It catches the errors in order to still be able to render the rest of the page.
- The Component Profiler captures the duration of rerendering and mounting of components.
- The Router (v4-v6) integration sends an event to the server for every router change.
- SSR support
The following code is an example of the ErrorBoundary configuration, still allowing `OtherComponents` to render even if `ShoppingCart` produces an error.
import { FaroErrorBoundary } from '@grafana/faro-react';

const Component = () => <Layout>
  <FaroErrorBoundary>
    <ShoppingCart />
  </FaroErrorBoundary>
  <OtherComponents />
</Layout>;
The following code illustrates how to configure the component profiler.
import { withFaroProfiler } from '@grafana/faro-react';

const Component = () => <Layout>
  {withFaroProfiler(<ShoppingCart />)}
  <OtherComponents />
</Layout>;
Grafana Agent
The endpoint receiving the data sent by Faro is the Grafana Agent, specifically the `app_agent_receiver` integration. For this to be available, the Agent has to be running in the older “static” mode and the `–enable-features=integrations-next` argument added to enable the integration. The integration is not yet available for the agent running in “flow” mode.
To configure these two options with the Helm chart, the following has to be added to the `values.yml`:
agent:
  mode: static
  extraArgs: [ '--enable-features=integrations-next' ]
A complete, but minimal example for the Agent’s configuration itself, which is passed as `agent.configMap.content` to the Helm chart:
integrations:
  app_agent_receiver_configs:
  - instance: frontend
    logs_instance: default
    logs_labels:
      app: frontend
      kind: null
    logs_send_timeout: 5000
    server:
      cors_allowed_origins:
      - http://localhost:3000
      - https://example.com
      host: "0.0.0.0"
      port: 12347
    sourcemaps:
      download: true
    traces_instance: default
logs:
  configs:
  - clients:
    - tenant_id: 1
      url: http://distributor.loki.svc.cluster.local:3100/loki/api/v1/push
    name: default
    scrape_configs: []
  positions_directory: /tmp/loki-pos
traces:
  configs:
  - name: default
    receivers:
      otlp:
        protocols:
          grpc: null
    remote_write:
    - endpoint: distributor.tempo.svc.cluster.local:4317
      insecure: true
The above configures the `app_agent_receiver` integration to listen on port 12347 for the data collected by Faro on `/collect`. The data is then sent to the traces and logs instances named `default`. An additional label `app` with the value of `frontend` is added, and the `kind` label is passed on. Source maps are automatically downloaded to correctly display stack traces in the logs and two hostnames are allowed by the CORS headers.
The `logs` and `traces` config below configures the targets where these are forwarded to, in this example Loki and Tempo running in microservices mode in the same Kubernetes cluster as the Agent.
Comparison to Other Tools
Comparable tools are Datadog, New Relic and Sentry. Common among all tools is the ability to receive traces via OTLP, Web Vitals metrics and request tracing. Also, all of them are available as cloud services, though only Grafana Faro and Sentry are open source and able to run on premises.
Datadog, New Relic and Sentry have good and easy to find documentation while Grafana Faro’s documentation is not as discoverable and in parts not as elaborate.
Also, Grafana Faro’s React integration does not work with the new-style `createBrowserRouter`. Both issues probably result from the tool being very new. Sentry, on the other hand, has a slightly better React integration, whereas New Relic has almost no React integration.
When it comes to deployment of the tools, Sentry upstream only supports a docker-compose setup. For Kubernetes, there only is a community-updated helm chart. On the other hand, Grafana tooling is already very common in Kubernetes environments. Hardly any new infrastructure is necessary, only an Agent configuration and a few lines of frontend code are needed, if Loki and Tempo are already deployed. For teams making use of the full Grafana stack, Faro integrates seamlessly and needs only little work to set up.


Schreibe einen Kommentar